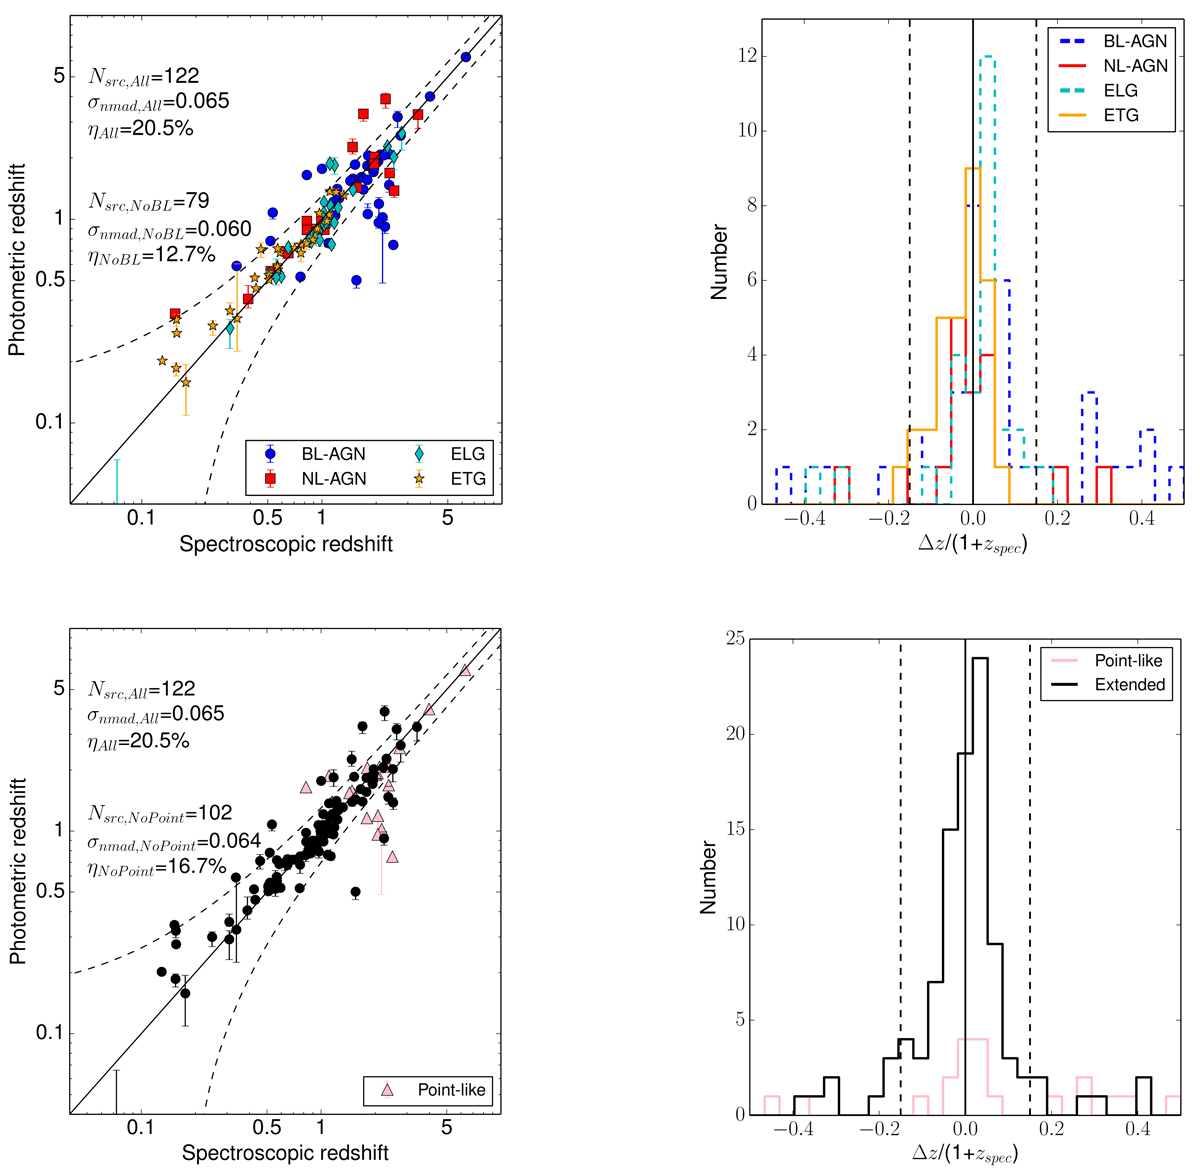
Fig. 7.
Download original image
Left: photometric redshift as a function of the spectroscopic one for the 122 J1030 sources with an available spectroscopic redshift. The black solid line marks the zspec = zphot relation, while the dashed lines contain the zphot = zspec ± 0.15(1 + zspec) region. Sources within this region are deemed to have a reliable photometric redshift. In the two panels, we highlight different classes of sources which are more likely to have a large fraction of outliers: spectroscopically classified BL–AGNs (blue circles, top); morphologically classified point-like sources (pink triangles, bottom). Right: distribution of Δz/(1 + zspec) for the sources reported in the left panel. The color code in the right panels matches that in the left panels.
Current usage metrics show cumulative count of Article Views (full-text article views including HTML views, PDF and ePub downloads, according to the available data) and Abstracts Views on Vision4Press platform.
Data correspond to usage on the plateform after 2015. The current usage metrics is available 48-96 hours after online publication and is updated daily on week days.
Initial download of the metrics may take a while.