Fig. 4.
Download original image
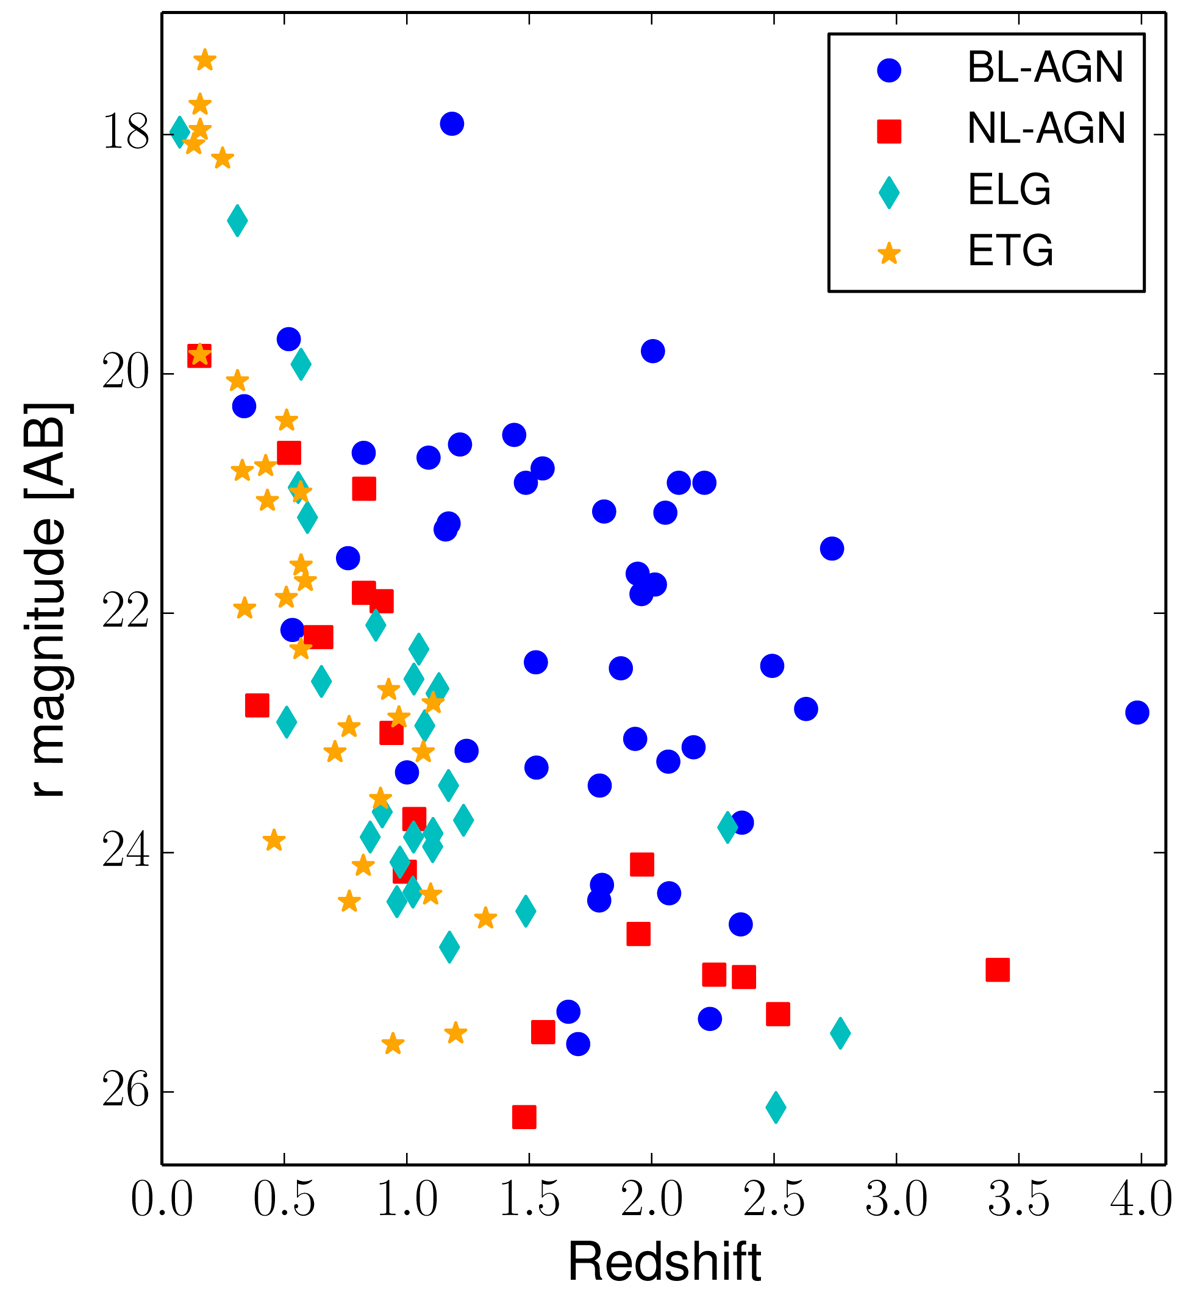
Total AB magnitude in the r band from Nanni et al. (2020) as a function of spectroscopic redshift for 122 Chandra J1030 sources with zspec: we do not include the z = 6.3 QSO SDSSJ1030+0525 in this plot, which is not detected in the r-band. BL–AGNs are plotted as blue circles, NL–AGN as red squares, ELGs as cyan diamonds, and ETGs as orange stars.
Current usage metrics show cumulative count of Article Views (full-text article views including HTML views, PDF and ePub downloads, according to the available data) and Abstracts Views on Vision4Press platform.
Data correspond to usage on the plateform after 2015. The current usage metrics is available 48-96 hours after online publication and is updated daily on week days.
Initial download of the metrics may take a while.