Fig. 15.
Download original image
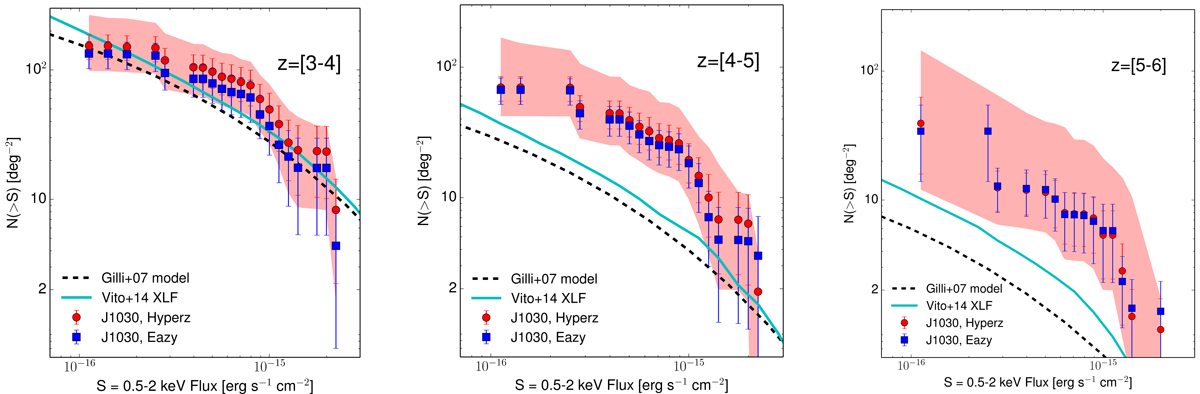
Chandra J1030 0.5–2 keV number counts computed using the Hyperz photometric redshifts (red circles in the redshift bins z = [3–4] (left), z = [4–5] (center), and z = [5–6] (right). The upper boundary of the shaded area is computed including the “low-reliability” sources defined in the text and two objects lacking a counterpart. The lower boundary is computed assuming a conservative PDZ shape (see the text for more details). The number counts derived using the EAzY photometric redshifts (blue squares) are also plotted for comparison. The number counts in the same redshift ranges derived using the Gilli et al. (2007) AGN population synthesis model (black dashed line) and the Vito et al. (2014) XLF (cyan solid line) are also shown for comparison.
Current usage metrics show cumulative count of Article Views (full-text article views including HTML views, PDF and ePub downloads, according to the available data) and Abstracts Views on Vision4Press platform.
Data correspond to usage on the plateform after 2015. The current usage metrics is available 48-96 hours after online publication and is updated daily on week days.
Initial download of the metrics may take a while.