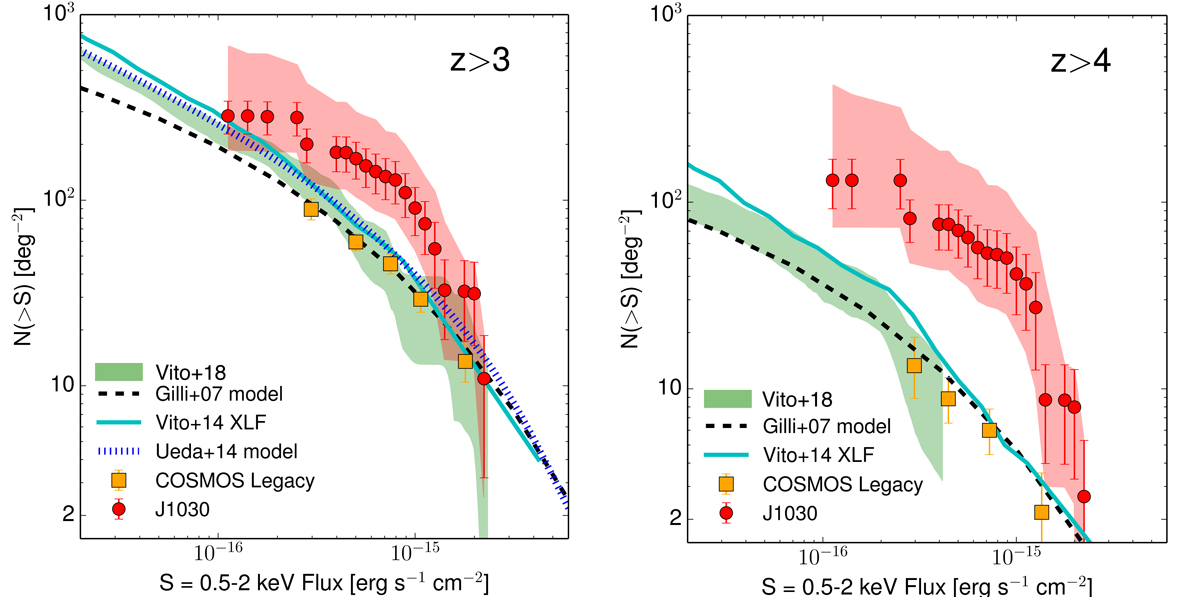
Fig. 14.
Download original image
z > 3 (left) and z > 4 (right) number counts for Chandra J1030 (red circles): the error bars are the Poissonian uncertainties. The upper boundary of the shaded area is obtained by including in the computation 21 “low-reliability” sources, which are those objects with only a K-band and/or an IRAC-band detection, as well as two objects with no counterpart. The lower boundary is computed assuming a conservative PDZ shape (see the main text for more details). The number counts obtained in the same redshift range in the Chandra COSMOS-Legacy survey (orange squares, Marchesi et al. 2016b) and in the CDF-S and CDF-N surveys (green area Vito et al. 2018) are also shown for comparison, together with the predictions from the Vito et al. (2014, cyan solid line) and Ueda et al. (2014, blue dotted line) X-ray luminosity functions, and those of the Gilli et al. (2007) AGN population synthesis model.
Current usage metrics show cumulative count of Article Views (full-text article views including HTML views, PDF and ePub downloads, according to the available data) and Abstracts Views on Vision4Press platform.
Data correspond to usage on the plateform after 2015. The current usage metrics is available 48-96 hours after online publication and is updated daily on week days.
Initial download of the metrics may take a while.