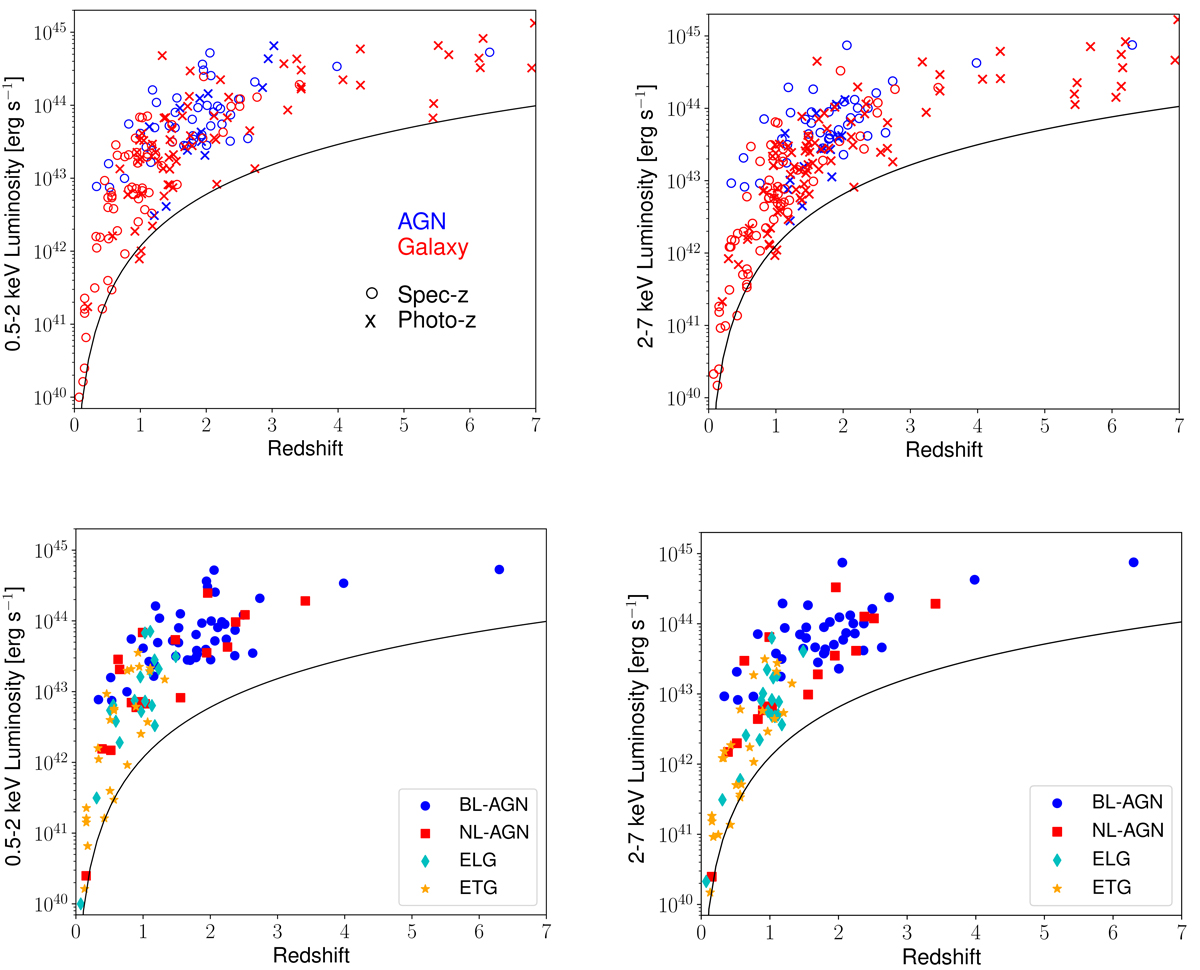
Fig. 11.
Download original image
Top: intrinsic, absorption-corrected luminosity in the 0.5–2 keV (left) and 2–7 keV (right) band as a function of redshift. Sources with a spectroscopic redshift are plotted with circles, while sources with only a photometric redshift are plotted with crosses. Sources with a BL–AGN or NL–AGN spectrum or with a SED best-fitted with an AGN template are plotted in blue, while sources with a ETG or ELG spectrum, or with a SED best-fitted with a galaxy template are plotted in red. We also plot, as a black solid line, the luminosity corresponding to the flux at which 10% of the field is covered. Bottom: same as above, but for the spectroscopic subsample alone. BL–AGNs are plotted as blue circles, NL–AGNs as red squares, emission line galaxies as cyan diamonds, and early-type galaxies as orange stars.
Current usage metrics show cumulative count of Article Views (full-text article views including HTML views, PDF and ePub downloads, according to the available data) and Abstracts Views on Vision4Press platform.
Data correspond to usage on the plateform after 2015. The current usage metrics is available 48-96 hours after online publication and is updated daily on week days.
Initial download of the metrics may take a while.