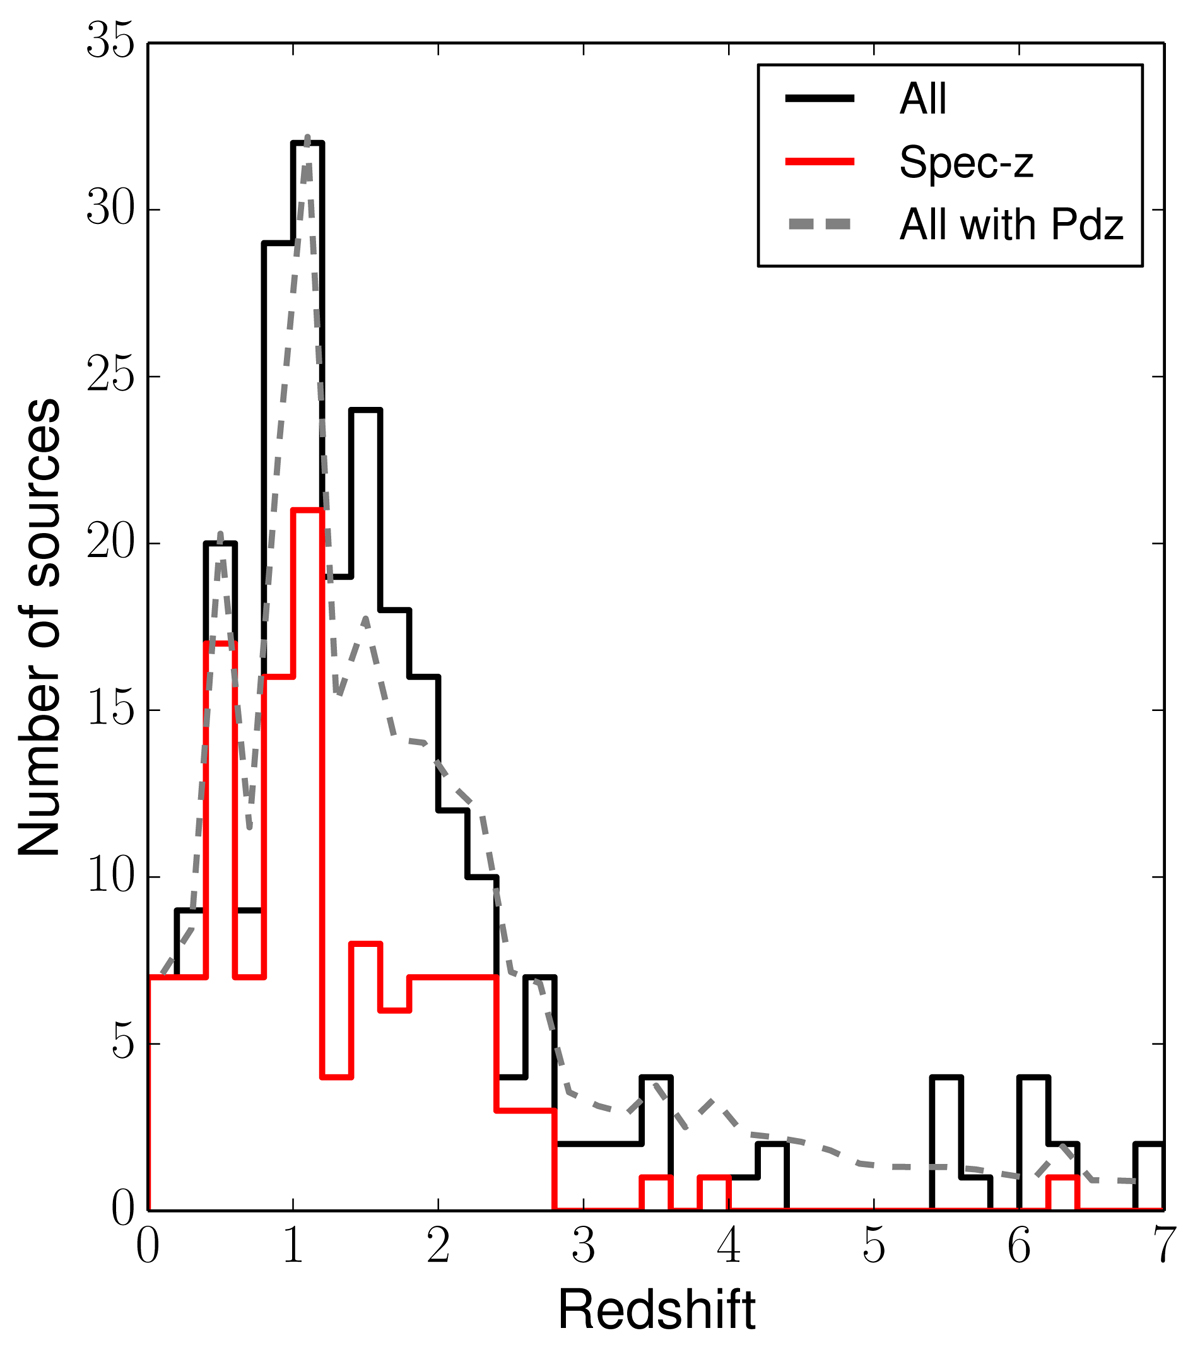
Fig. 10.
Download original image
Redshift distribution of the 243 Chandra J1030 sources with an optical and/or IR counterpart. The black solid line shows the overall distribution computed using the best-fit redshift value, while the gray dashed line shows the distribution obtained by summing all the redshift probability distribution function values (for photometric redshifts; spectroscopic redshifts are assumed to have PDZ = 1 at their zspec value). The spectroscopic redshift distribution is shown as a red solid line.
Current usage metrics show cumulative count of Article Views (full-text article views including HTML views, PDF and ePub downloads, according to the available data) and Abstracts Views on Vision4Press platform.
Data correspond to usage on the plateform after 2015. The current usage metrics is available 48-96 hours after online publication and is updated daily on week days.
Initial download of the metrics may take a while.