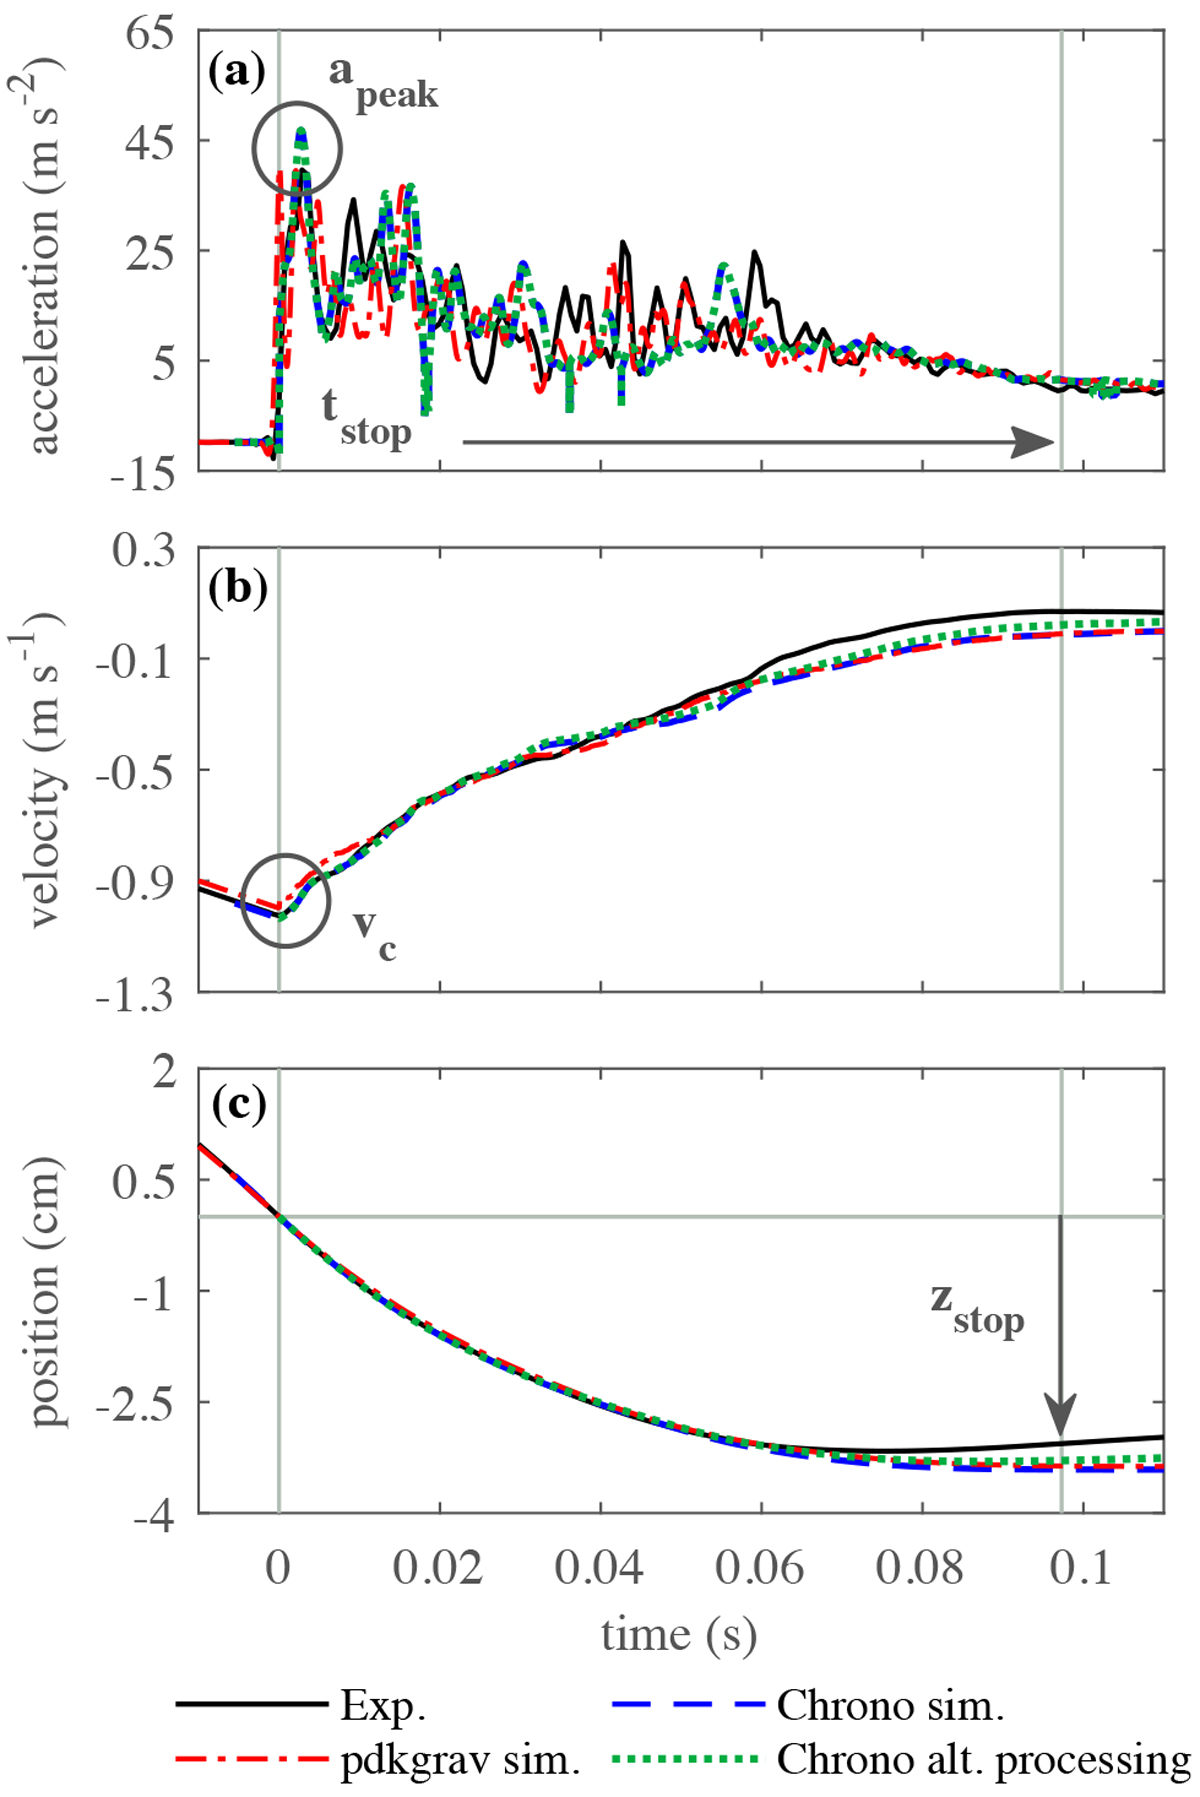
Fig. 2
Download original image
Acceleration, velocity, and position profiles for an example experiment (black), a Chrono simulation (blue), and a pkdgrav simulation (red). The green line shows the Chrono simulation data when processed using the same method as the experimental data. The projectile’s approximate collision velocity vc, peak acceleration apeak, penetration depth zstop, and collision duration tstop are indicated by the black text and arrows.
Current usage metrics show cumulative count of Article Views (full-text article views including HTML views, PDF and ePub downloads, according to the available data) and Abstracts Views on Vision4Press platform.
Data correspond to usage on the plateform after 2015. The current usage metrics is available 48-96 hours after online publication and is updated daily on week days.
Initial download of the metrics may take a while.