Fig. 10
Download original image
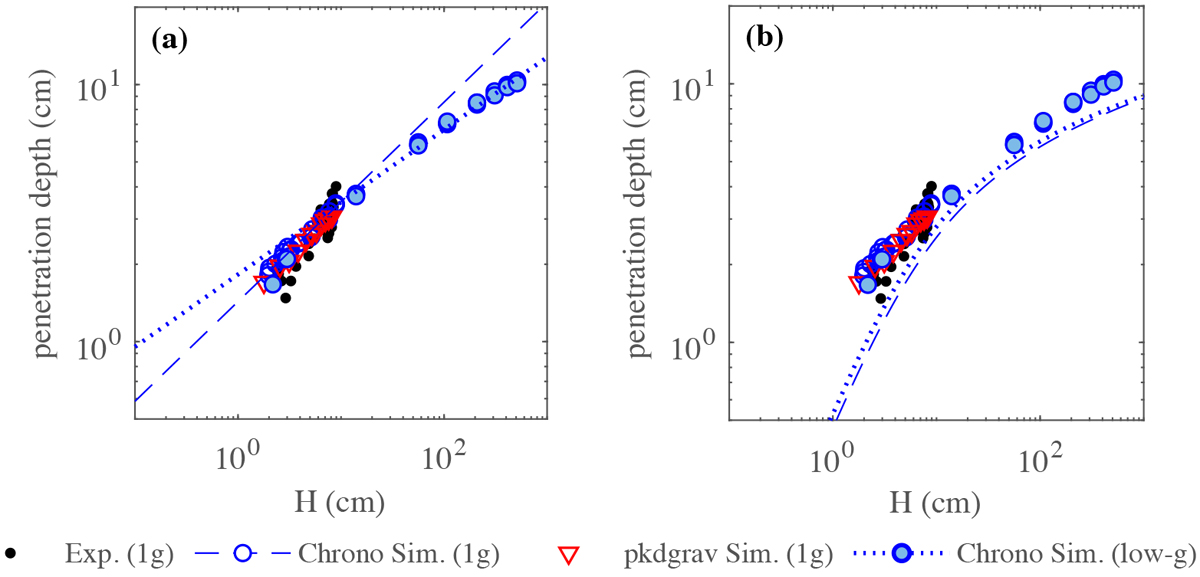
Penetration depth zstop by total height H for the 10 mm glass bead experiments and simulations. H is the drop height plus the penetration depth. The blue lines in plot (a) represent the data fits to zstop ~ Hα for the Chrono simulations. The α values for all of the data sets are listed in Table 3. The blue lines in plot (b) represent the penetration depth relationship for the Chrono simulations based on Eq. (3) (i.e., the Poncelet model) and the fit parameters provided in Table 3.
Current usage metrics show cumulative count of Article Views (full-text article views including HTML views, PDF and ePub downloads, according to the available data) and Abstracts Views on Vision4Press platform.
Data correspond to usage on the plateform after 2015. The current usage metrics is available 48-96 hours after online publication and is updated daily on week days.
Initial download of the metrics may take a while.