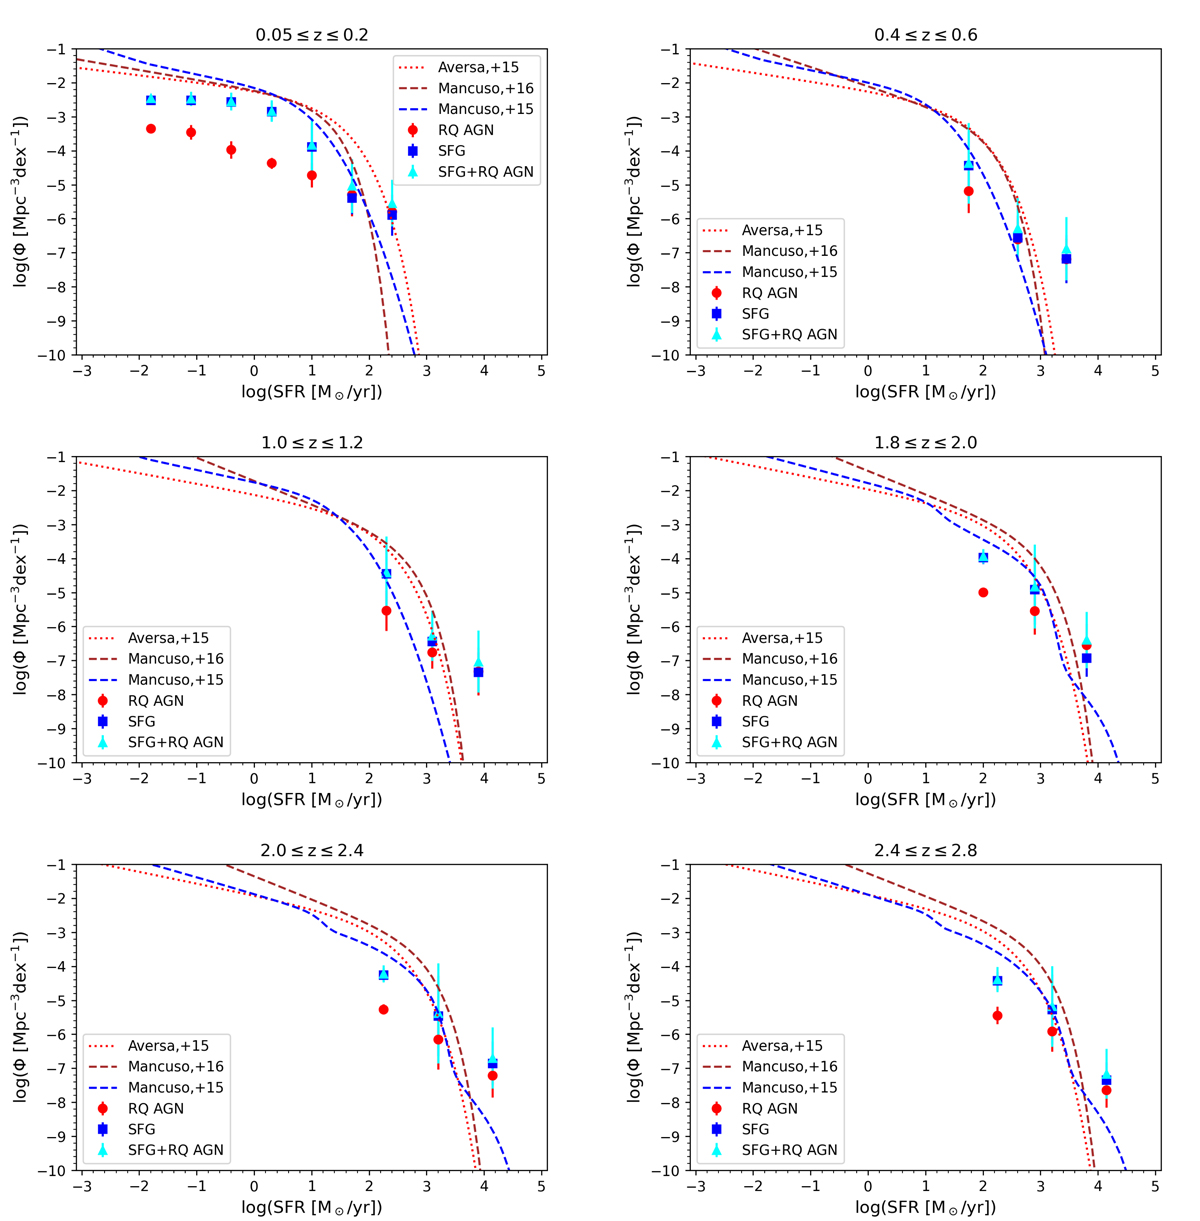
Fig. 9.
Download original image
Comparison of our observational estimates of the SFR functions with the theoretical ones by Mancuso et al. (2015, blue dashed lines), Aversa et al. (2015, red dotted lines) and Mancuso et al. (2016, brown dashed lines). The lines can be seen as representations of observational estimates of the SFR functions based on combinations of classical UV and FIR star-formation tracers (see text). They indicate that the LoTSS data allow us to measure space densities of typical high-z SFGs, with SFR ∼ 100 M⊙ yr−1, up to z ≃ 2.5. The two inflection points, at log(SFR/M⊙ yr−1)≃1 and ≃3.5, of the Mancuso et al. (2015) line for z > 1.5 correspond to the transition from the dominance of late-type galaxies to that of star-forming protospheroids and to the dominance of strongly lensed galaxies, respectively. The error bars are the quadratic sums of Poisson uncertainties and of sample variance; they are generally smaller than the symbols. The real uncertainties are much larger, especially at z > 1 where the quality of photometric redshifts increasingly worsens, but difficult to quantify.
Current usage metrics show cumulative count of Article Views (full-text article views including HTML views, PDF and ePub downloads, according to the available data) and Abstracts Views on Vision4Press platform.
Data correspond to usage on the plateform after 2015. The current usage metrics is available 48-96 hours after online publication and is updated daily on week days.
Initial download of the metrics may take a while.