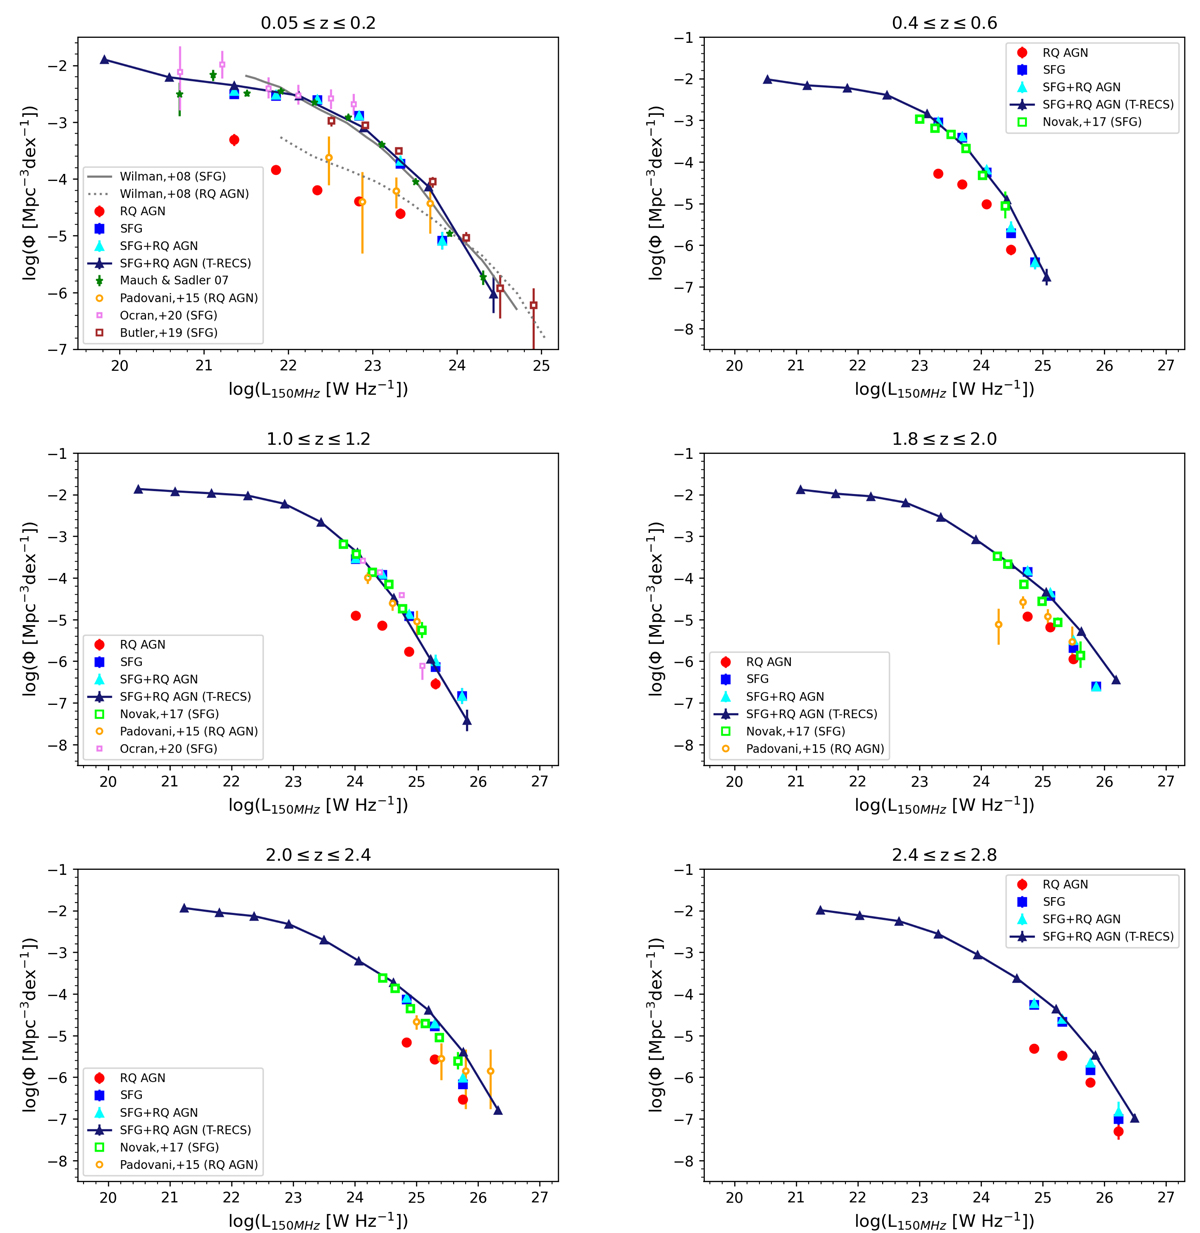
Fig. 8.
Download original image
Comparison of our estimates of the 150 MHz luminosity functions (LFs) of non-radio excess sources (SFGs and RQ AGN) at representative redshifts with those of SFGs (including RQ AGN) from the T-RECS simulations (Bonaldi et al. 2019). Our LFs are also compared with the LF estimates at 1.4 GHz by Butler et al. (2019), Novak et al. (2017), Padovani et al. (2015) and Mauch & Sadler (2007), and at 610 MHz by Ocran et al. (2020), all scaled to 150 MHz using a spectral index α = −0.73. The local (0.05 ≤ z ≤ 0.2) LFs are also compared with the Wilman et al. (2008) model for SFGs and RQ AGN. The error bars are the quadratic sums of Poisson uncertainties and of sample variance; they are generally smaller than the symbols. The real uncertainties are much larger, especially at z > 1 where the quality of photometric redshifts increasingly worsens, but are difficult to quantify.
Current usage metrics show cumulative count of Article Views (full-text article views including HTML views, PDF and ePub downloads, according to the available data) and Abstracts Views on Vision4Press platform.
Data correspond to usage on the plateform after 2015. The current usage metrics is available 48-96 hours after online publication and is updated daily on week days.
Initial download of the metrics may take a while.