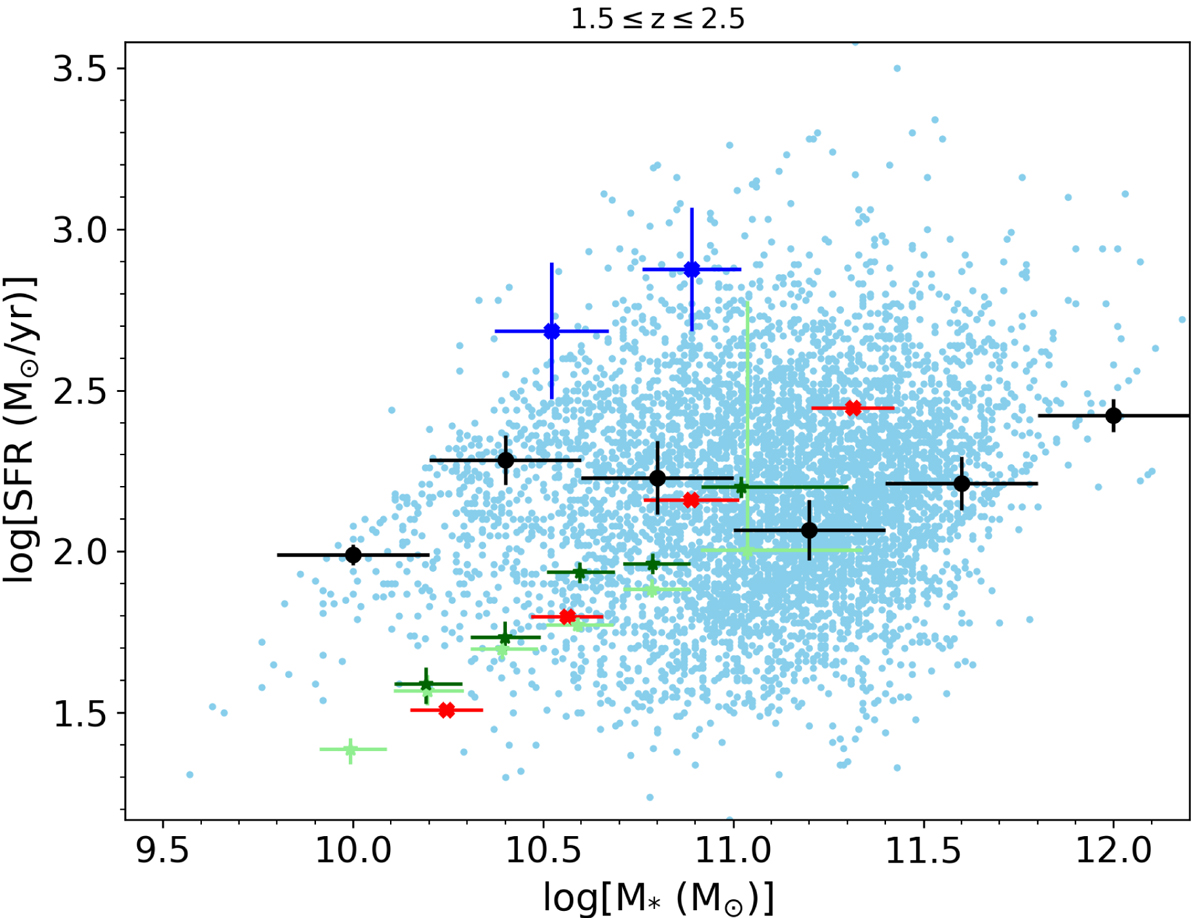
Fig. 7.
Download original image
Distribution in the SFR–M⋆ plane of our SFGs and RQ AGN in the 1.5 ≤ z ≤ 2.5 redshift interval (cyan points). The black filled circles with error bars show the modes of the SFR distributions averaged over the stellar mass bins represented by horizontal bars. The numbers of sources in each bin, from low to high M⋆, are 93, 511, 1511, 2491, 1001, and 50, respectively. The vertical bars show the dispersions. The red symbols represent the average values for the Rodighiero et al. (2015)K-band selected sample of SFGs. The upper blue points show the average SFRs for the Rodighiero et al. (2015) sample of starburst galaxies in their two mass bins. The green asterisks represent the Leslie et al. (2020) median values for their SFG sample (light green for their 1.5–2 redshift range, dark green for 2–2.5).
Current usage metrics show cumulative count of Article Views (full-text article views including HTML views, PDF and ePub downloads, according to the available data) and Abstracts Views on Vision4Press platform.
Data correspond to usage on the plateform after 2015. The current usage metrics is available 48-96 hours after online publication and is updated daily on week days.
Initial download of the metrics may take a while.