Fig. 4.
Download original image
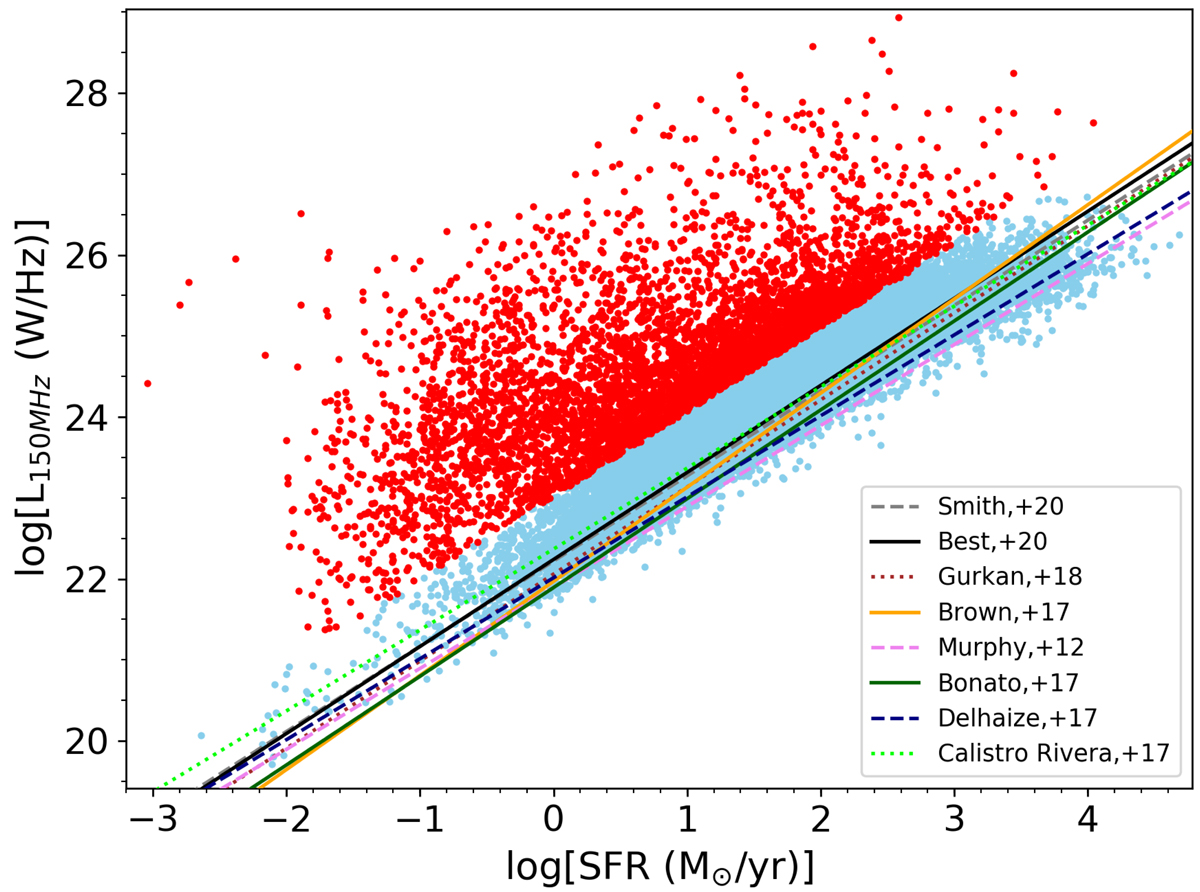
Radio luminosity at 150 MHz versus SFR. Red and cyan points represent, respectively, RL AGN and non-RL sources (i.e. SFGs plus RQ AGN). The black solid line shows the ridge line in the radio–SFR relation used by Best et al. (in prep.) to define the radio excess threshold (0.7 dex above the ridge line) separating RL AGN from SFGs plus RQ AGN. Also shown, for comparison, are the relations by Smith et al. (2021, grey dashed line), by Gürkan et al. (2018, brown dotted line), Bonato et al. (2017, non-linear model; dark green solid line), Delhaize et al. (2017, dark blue dashed line), Brown et al. (2017, orange solid line), Calistro Rivera et al. (2017, light green dotted line) and Murphy et al. (2012, pink dashed line).
Current usage metrics show cumulative count of Article Views (full-text article views including HTML views, PDF and ePub downloads, according to the available data) and Abstracts Views on Vision4Press platform.
Data correspond to usage on the plateform after 2015. The current usage metrics is available 48-96 hours after online publication and is updated daily on week days.
Initial download of the metrics may take a while.