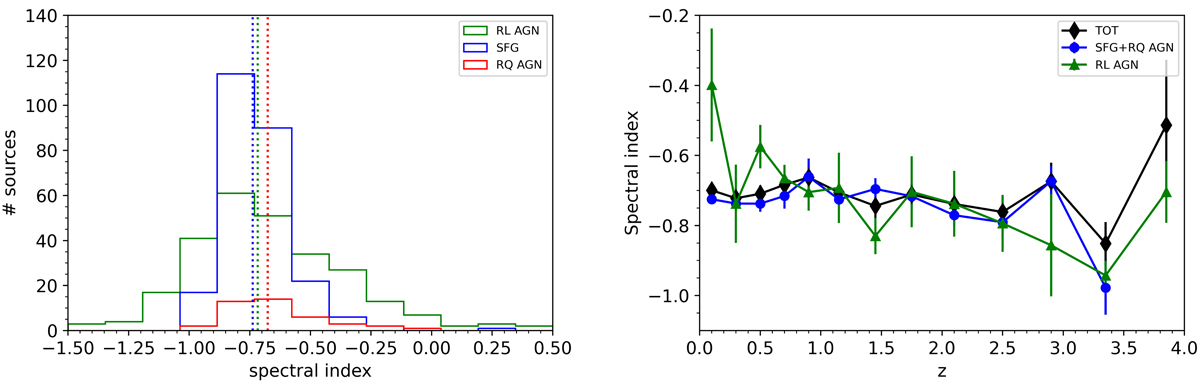
Fig. 3.
Download original image
Left panel: spectral index distributions of the 3 source populations. The median spectral indices (vertical lines) are: −0.72 for RL AGN, −0.74 for SFGs and −0.68 for RQ AGN. Right panel: redshift dependence of the median spectral indices of sources classified as RL AGN (filled green triangles) and as non-RL AGN (i.e. as SFGs or RQ AGN; filled blue circles) based on both WSRT and LOFAR data. The filled black diamonds (‘TOT’) represent the median values for the full set of WSRT sources with LOFAR counterparts, including those with different classifications and the unclassified ones. Error bars are the interquartile ranges divided by the square root of the number of objects in the bin. A slight trend towards a steepening of the spectral index with increasing z is visible, especially in the case of RL AGN, but its statistical significance is low (see text).
Current usage metrics show cumulative count of Article Views (full-text article views including HTML views, PDF and ePub downloads, according to the available data) and Abstracts Views on Vision4Press platform.
Data correspond to usage on the plateform after 2015. The current usage metrics is available 48-96 hours after online publication and is updated daily on week days.
Initial download of the metrics may take a while.