Fig. 7.
Download original image
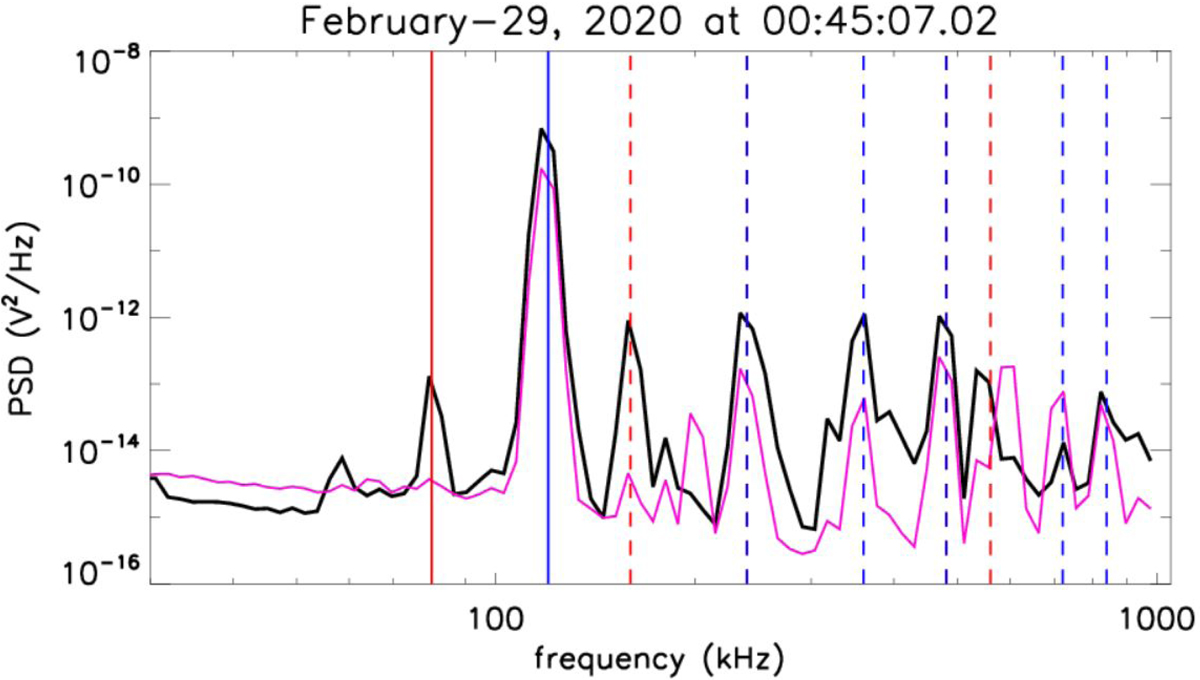
Typical TNR spectrum in monopole mode, recorded on February 29, 2020 at 00:45:07.02. The PCDU and RW spurious peaks are indicated by the blue and red vertical lines, respectively. In addition, we display some of the harmonics (2, 3, 4 6, and 7 for the 120 kHz and 2, 3, 6, and 7 for the 80 kHz) of these two frequencies with dashed vertical lines.
Current usage metrics show cumulative count of Article Views (full-text article views including HTML views, PDF and ePub downloads, according to the available data) and Abstracts Views on Vision4Press platform.
Data correspond to usage on the plateform after 2015. The current usage metrics is available 48-96 hours after online publication and is updated daily on week days.
Initial download of the metrics may take a while.