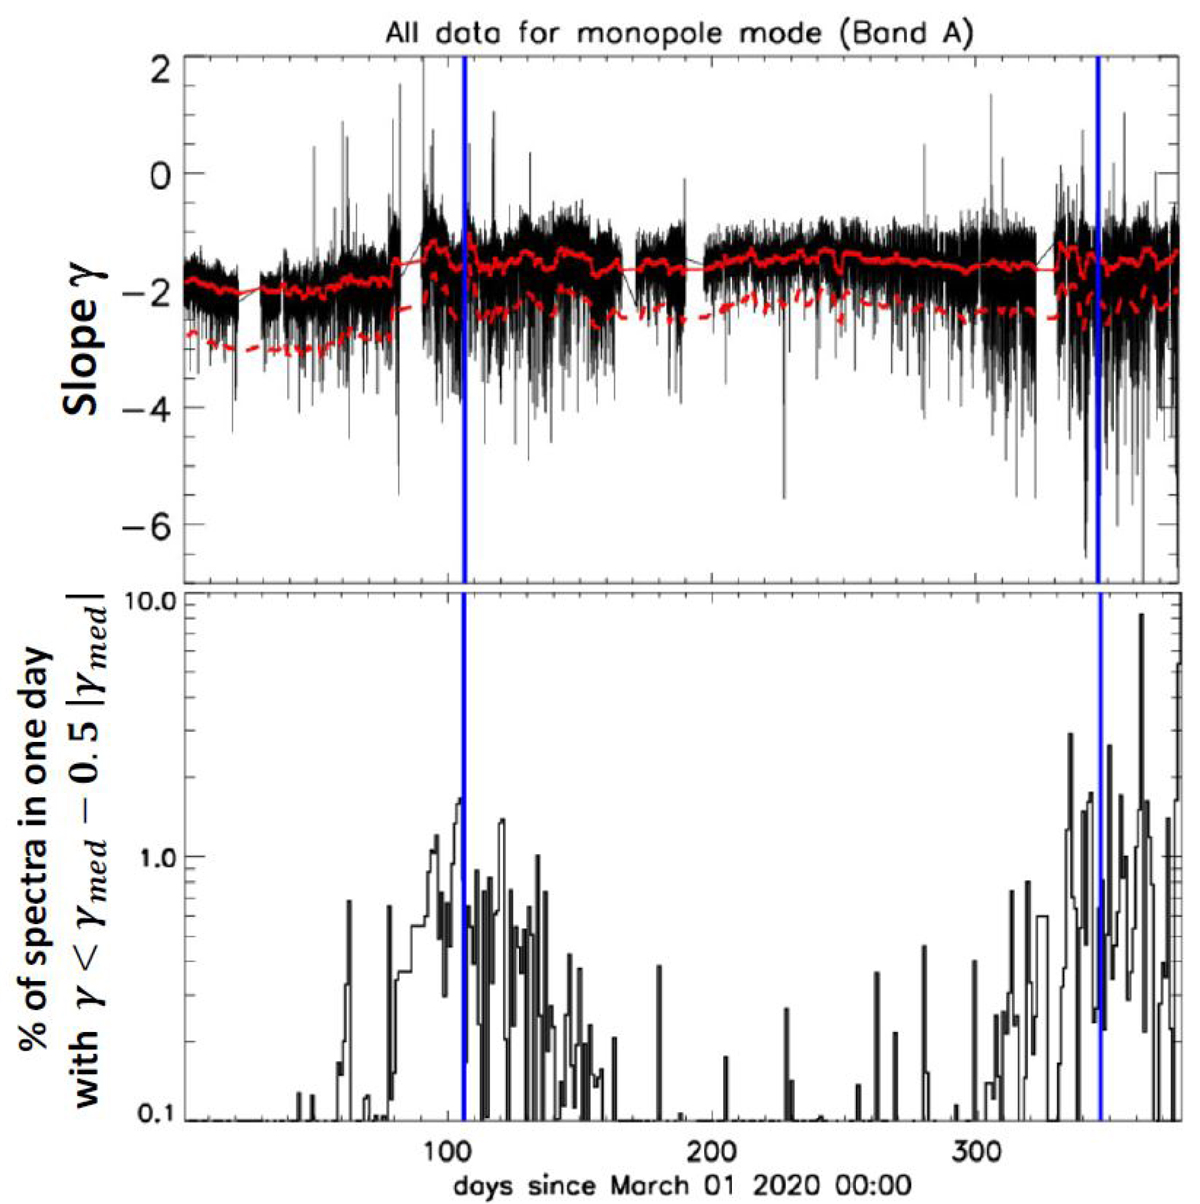
Fig. 5.
Download original image
Outcome of the statistical analysis of all the TNR Band A data from March 1st, 2020 to March 12th, 2021. Upper panel: power index γ resulting from a power law fitting of the form PSDA = PSD0 × fγ. The daily median values γmed of the power index γ are displayed with the red full line. The red dashed line represents γmed − 0.5 × |γmed|. Lower panel: daily percentage of spectra with γ < γmed − 0.5 × |γmed|. This daily percentage is assumed to be a measure of the dust impact rate on Solar Orbiter. The vertical blue lines in both panels represent the first two perihelia of Solar Orbiter. The first one correspond to June 15, 2020 when the probe was at 0.51 au from the Sun and the second to February 10, 2021 when it was at 0.49 au.
Current usage metrics show cumulative count of Article Views (full-text article views including HTML views, PDF and ePub downloads, according to the available data) and Abstracts Views on Vision4Press platform.
Data correspond to usage on the plateform after 2015. The current usage metrics is available 48-96 hours after online publication and is updated daily on week days.
Initial download of the metrics may take a while.