Fig. 3.
Download original image
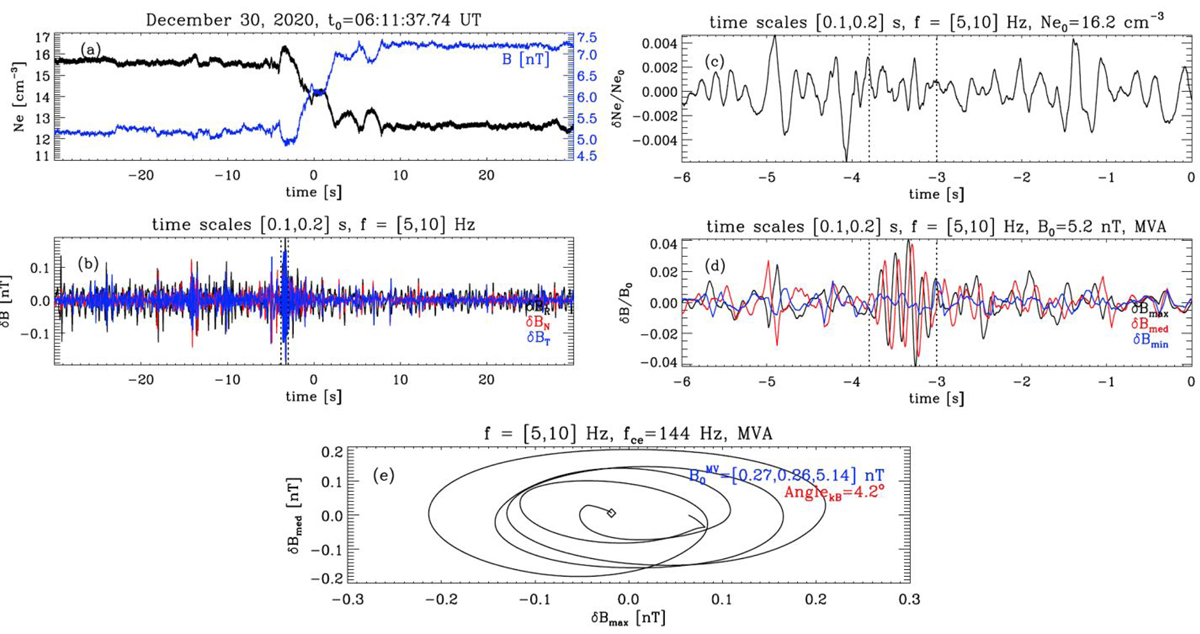
Example of a discontinuity automatically detected by SBM1 mode on-board on December 30, 2020, one minute time interval around 06:11:37.74 UT. a: MAG magnetic field (blue line) and electron density (in black) from RPW; b: SCM magnetic fluctuations δB for [5, 10] Hz frequency range in the RTN frame, two vertical dotted lines indicate a localized wave emission; c: density fluctuations within the same frequency range, normalized to its mean δNe/Ne0 within a 6 s time interval before the discontinuity; d: normalized magnetic fluctuations δB/B0 in the minimum variance frame for the same time interval as (c); e: polarization of the wave packet, diamond indicates the starting time point −3.8 s.
Current usage metrics show cumulative count of Article Views (full-text article views including HTML views, PDF and ePub downloads, according to the available data) and Abstracts Views on Vision4Press platform.
Data correspond to usage on the plateform after 2015. The current usage metrics is available 48-96 hours after online publication and is updated daily on week days.
Initial download of the metrics may take a while.