Fig. 2.
Download original image
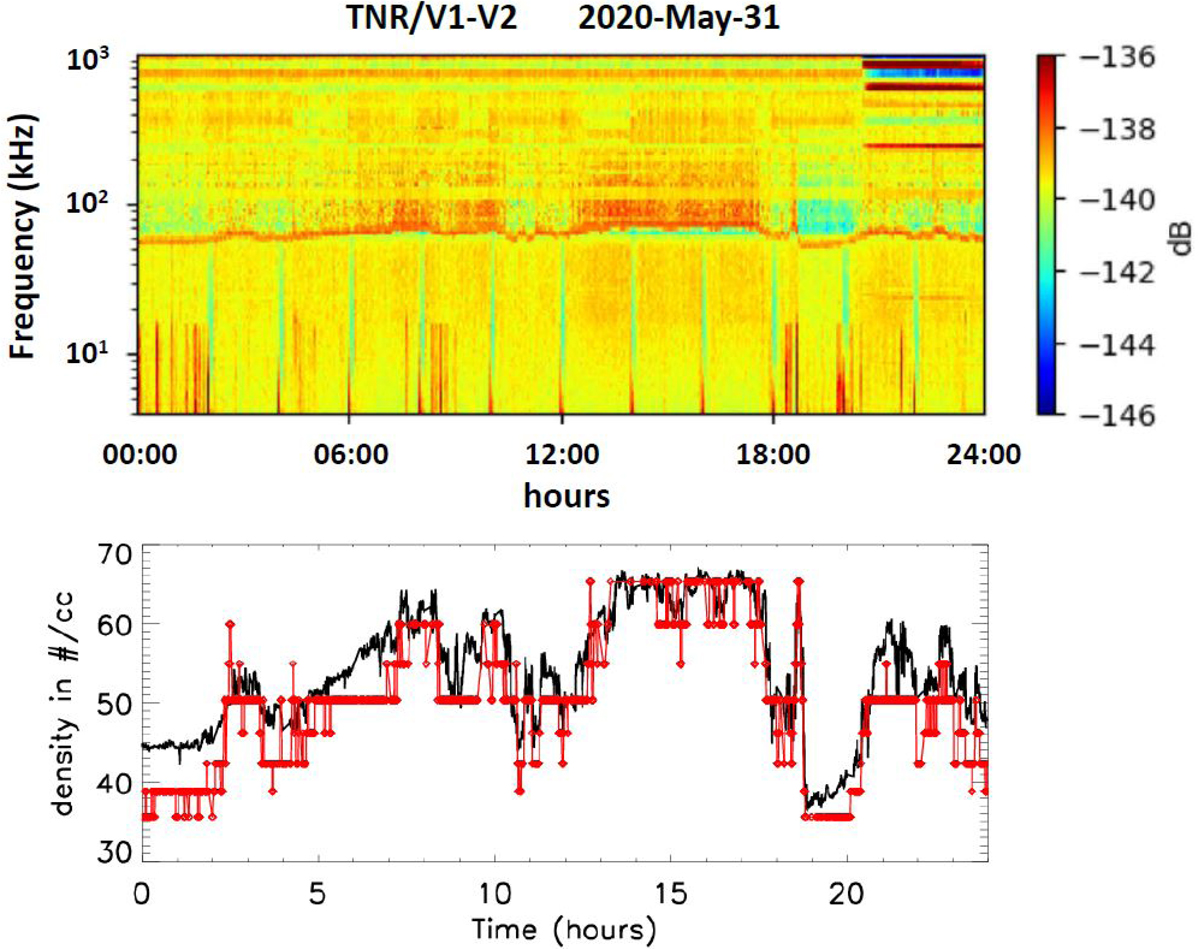
Upper panel: TNR dynamic spectrum of the V1 − V2 (PZ-PY) dipole signal. The plasma frequency can clearly be seen and varies between roughly 55 and 75 kHz. Using a peak tracking technique it is possible to detect the plasma frequency and deduce the temporal variation of the local electron density Ne − fp displayed in red on the lower panel. Superimposed in black on the lower panel is the electron density Ne − S/C deduced from the spacecraft potential (Khotyaintsev et al. 2021), after calibration to Ne − fp over longer time interval.
Current usage metrics show cumulative count of Article Views (full-text article views including HTML views, PDF and ePub downloads, according to the available data) and Abstracts Views on Vision4Press platform.
Data correspond to usage on the plateform after 2015. The current usage metrics is available 48-96 hours after online publication and is updated daily on week days.
Initial download of the metrics may take a while.