Open Access
Fig. 11.
Download original image
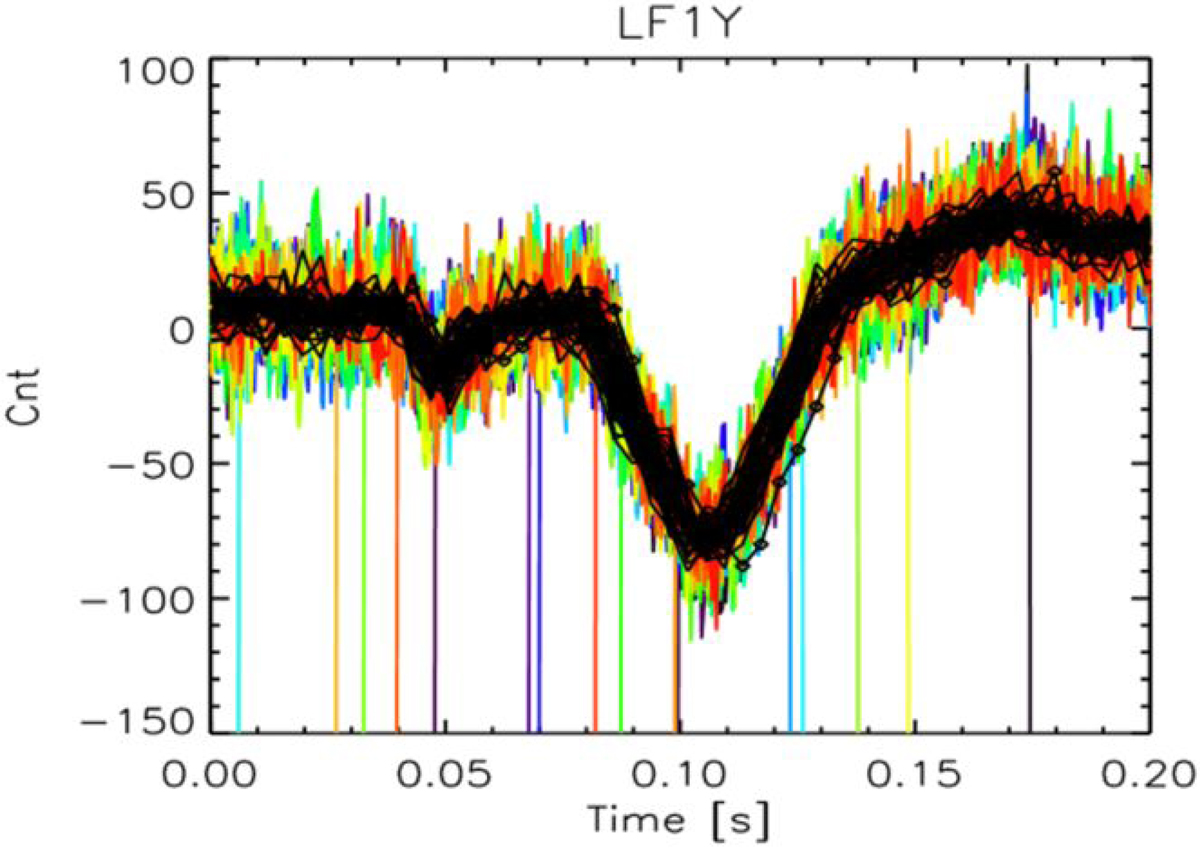
Zoom on the SCM heater signature on the LF1Y antenna. Each color corresponds to one observation. The vertical lines are caused by the plotting procedure and are not due to SCM signal variations.
Current usage metrics show cumulative count of Article Views (full-text article views including HTML views, PDF and ePub downloads, according to the available data) and Abstracts Views on Vision4Press platform.
Data correspond to usage on the plateform after 2015. The current usage metrics is available 48-96 hours after online publication and is updated daily on week days.
Initial download of the metrics may take a while.