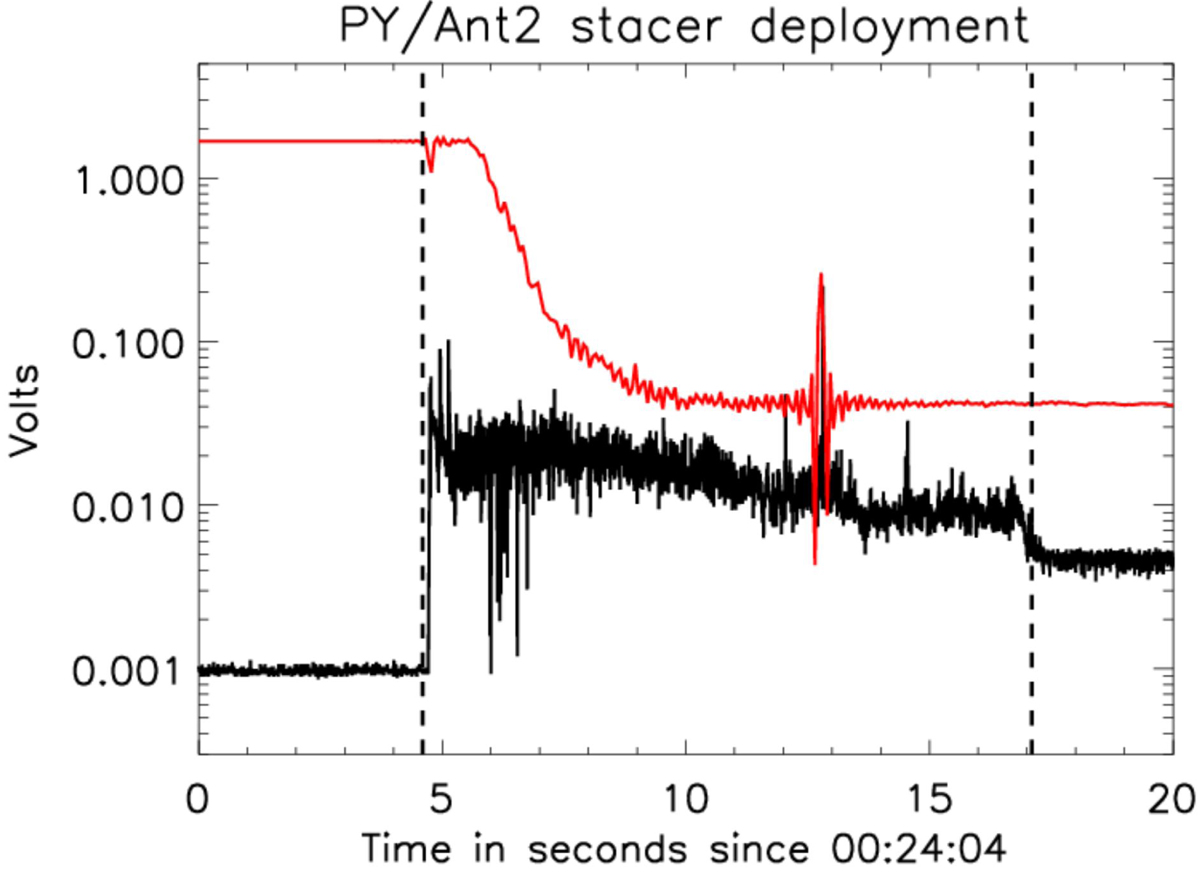
Fig. 1.
Download original image
LFR PY-PZ probe-to-probe electric potential (in red) and TDS time series of the PY maximum amplitude electric potential (in black). Since the PZ antenna was already deployed at the time of the PY antenna deployment, these two combined quantities are good indicators of the duration of the PY stacer deployment, which was 12.5 s (the time interval between the two dashed vertical lines).
Current usage metrics show cumulative count of Article Views (full-text article views including HTML views, PDF and ePub downloads, according to the available data) and Abstracts Views on Vision4Press platform.
Data correspond to usage on the plateform after 2015. The current usage metrics is available 48-96 hours after online publication and is updated daily on week days.
Initial download of the metrics may take a while.