Fig. 2.
Download original image
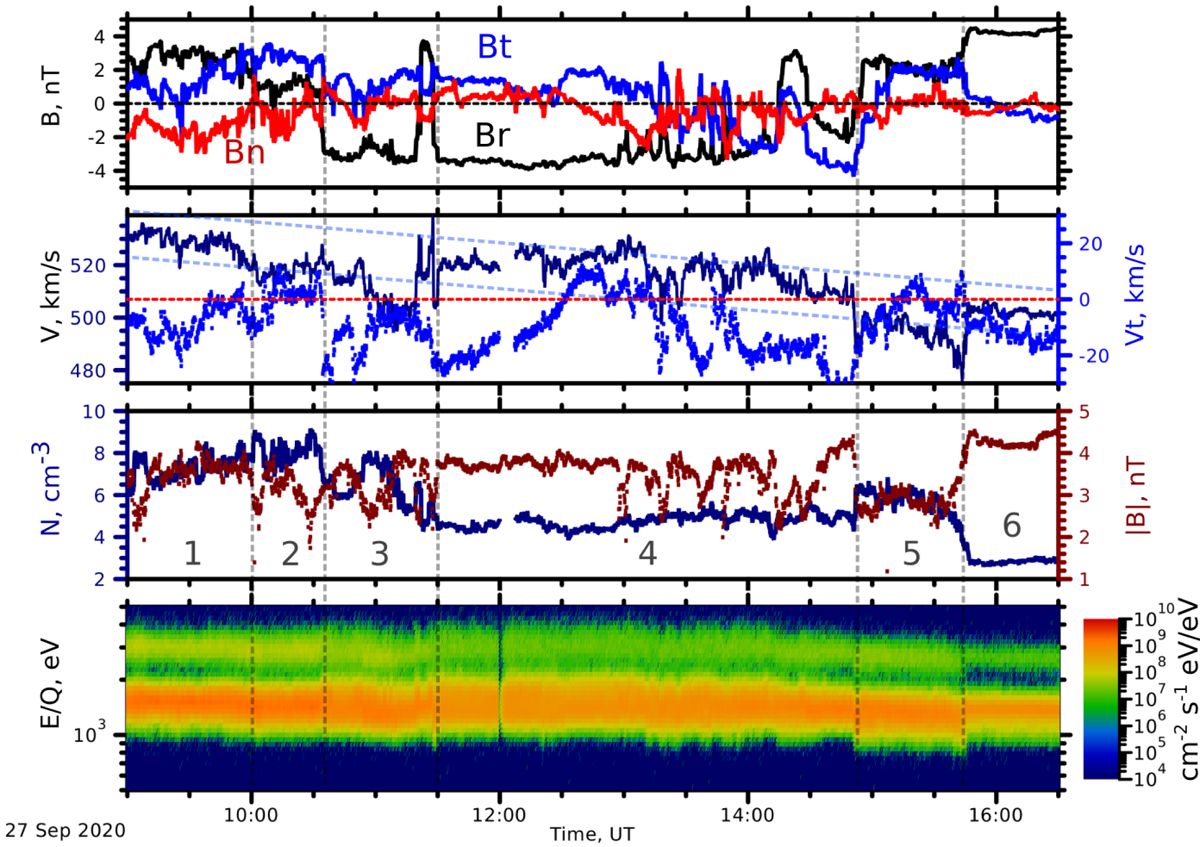
SolO measurements. From top to bottom: magnetic field in RTN frame, full proton velocity (navy) and tangential velocity (blue), number density (navy), and the magnetic field magnitude (blue), E/Q-time spectrogram of the differential ion energy flux. The vertical dashed lines marked the regions boundaries, explained in the text. The dashed light blue lines, in the second from the top panel, show the trend of maximal and minimal solar wind velocities. The plot is divided into six time intervals, as discussed in the text.
Current usage metrics show cumulative count of Article Views (full-text article views including HTML views, PDF and ePub downloads, according to the available data) and Abstracts Views on Vision4Press platform.
Data correspond to usage on the plateform after 2015. The current usage metrics is available 48-96 hours after online publication and is updated daily on week days.
Initial download of the metrics may take a while.