Free Access
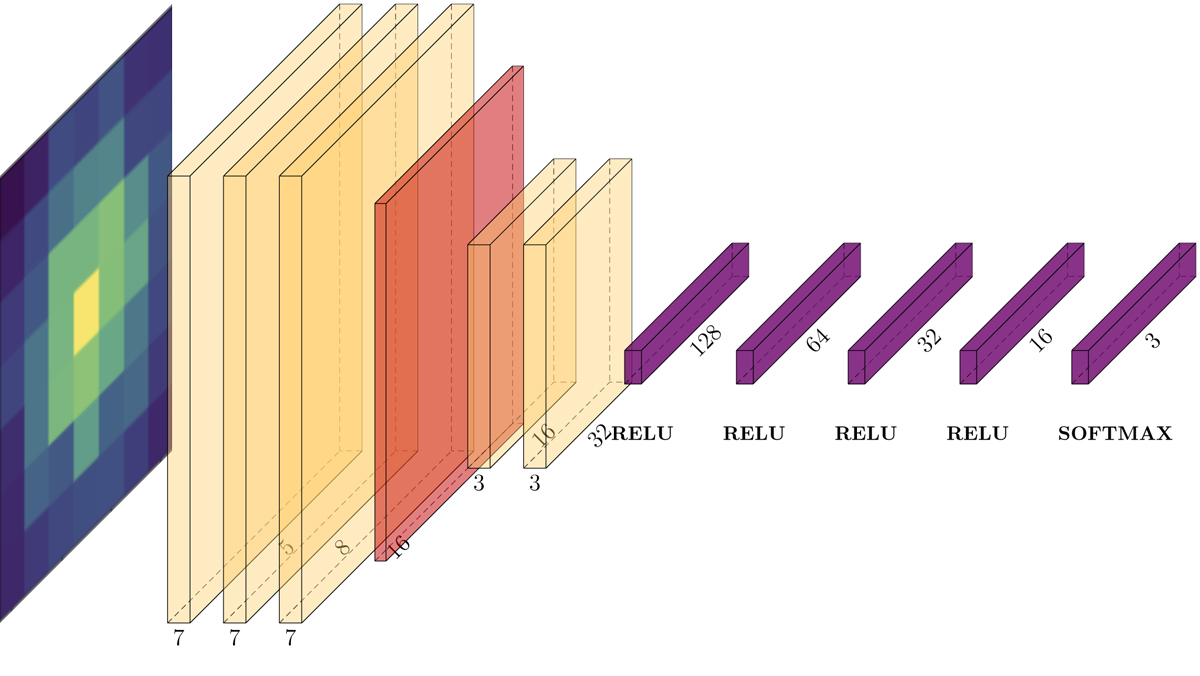
Fig. 9.
Download original image
Visualization of the classification network. The first layer is a batch normalization layer (Ioffe & Szegedy 2015) on a 7 × 7 image with 5 energy bins. Next are four convolutional layers and a max-pool layer and then five dense layers that make an output prediction.
Current usage metrics show cumulative count of Article Views (full-text article views including HTML views, PDF and ePub downloads, according to the available data) and Abstracts Views on Vision4Press platform.
Data correspond to usage on the plateform after 2015. The current usage metrics is available 48-96 hours after online publication and is updated daily on week days.
Initial download of the metrics may take a while.