Fig. 8.
Download original image
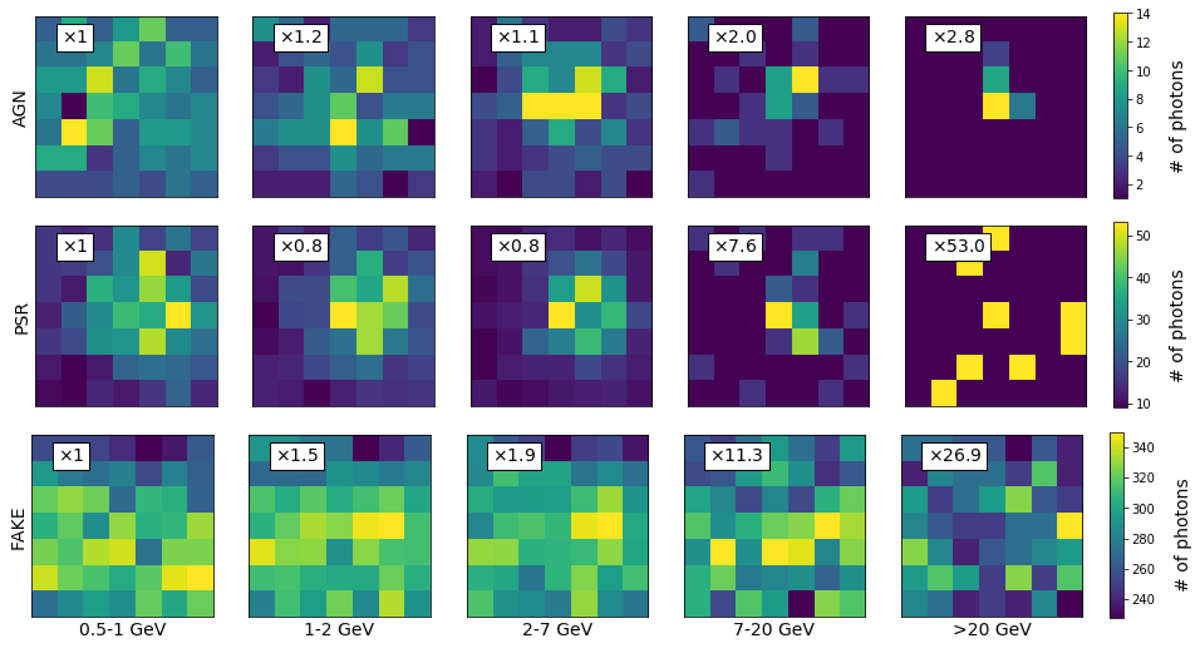
From left to right: map of photon number count for each energy bin for an example source of each class in each row. The color scale for each point source class is normalized to the maximum count of the first energy bin and we write in text box the level of amplification necessary for higher energy bins. Top panel shows AGN source class which has a spectrum extending to the highest energy while the PSR (middle panel) cuts off at energies of few GeV. The bottom panel shows an example of a FAKE source.
Current usage metrics show cumulative count of Article Views (full-text article views including HTML views, PDF and ePub downloads, according to the available data) and Abstracts Views on Vision4Press platform.
Data correspond to usage on the plateform after 2015. The current usage metrics is available 48-96 hours after online publication and is updated daily on week days.
Initial download of the metrics may take a while.