Fig. 7.
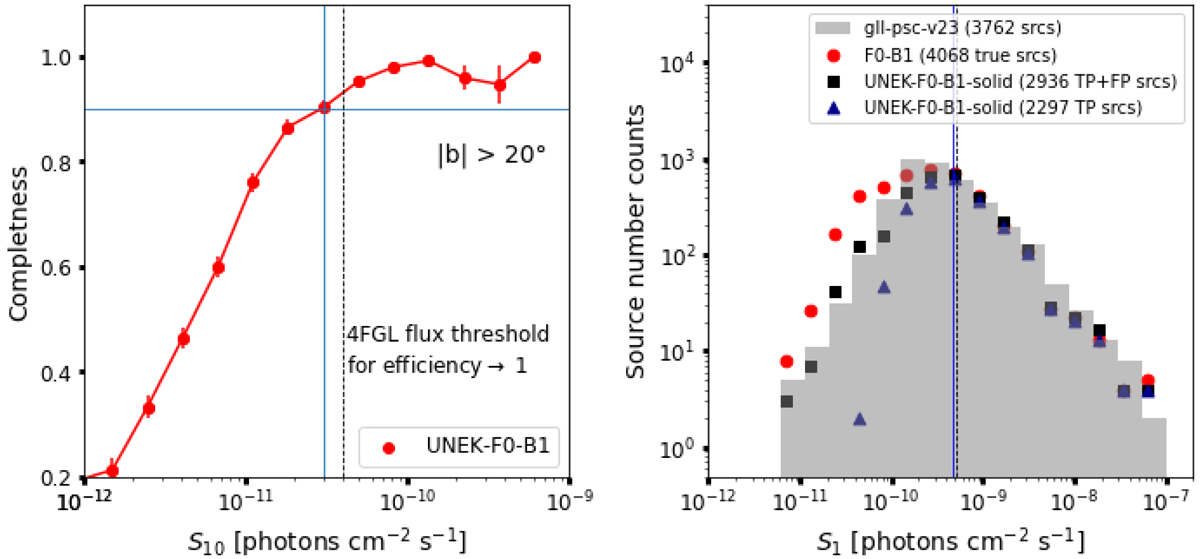
Download original image
Left: completness of our algorithm at high latitudes (b > 20°) as a function of S10 flux. Blue line marks the S90 flux in our analysis, while black dashed line marks the corresponding value from (Di Mauro et al. 2018). Right: the gray histogram represents the numbers of AGNs and PSRs from the 4FGL catalog, as a function of the S1 source flux. Red dots represent the source numbers from our F0 test catalog. Black dots represent sources that are recovered from F0 by our algorithm, accounting for true and false positives (TP+FP). Blue dots represent only TP. Notice that we got rid of FP by using the classification algorithm (see Sect. 4). Vertical lines are drawn to guide the eye and represent proxies for detection thresholds in our analysis (blue) and 4FGL (black, dashed).
Current usage metrics show cumulative count of Article Views (full-text article views including HTML views, PDF and ePub downloads, according to the available data) and Abstracts Views on Vision4Press platform.
Data correspond to usage on the plateform after 2015. The current usage metrics is available 48-96 hours after online publication and is updated daily on week days.
Initial download of the metrics may take a while.