Fig. A.2.
Download original image
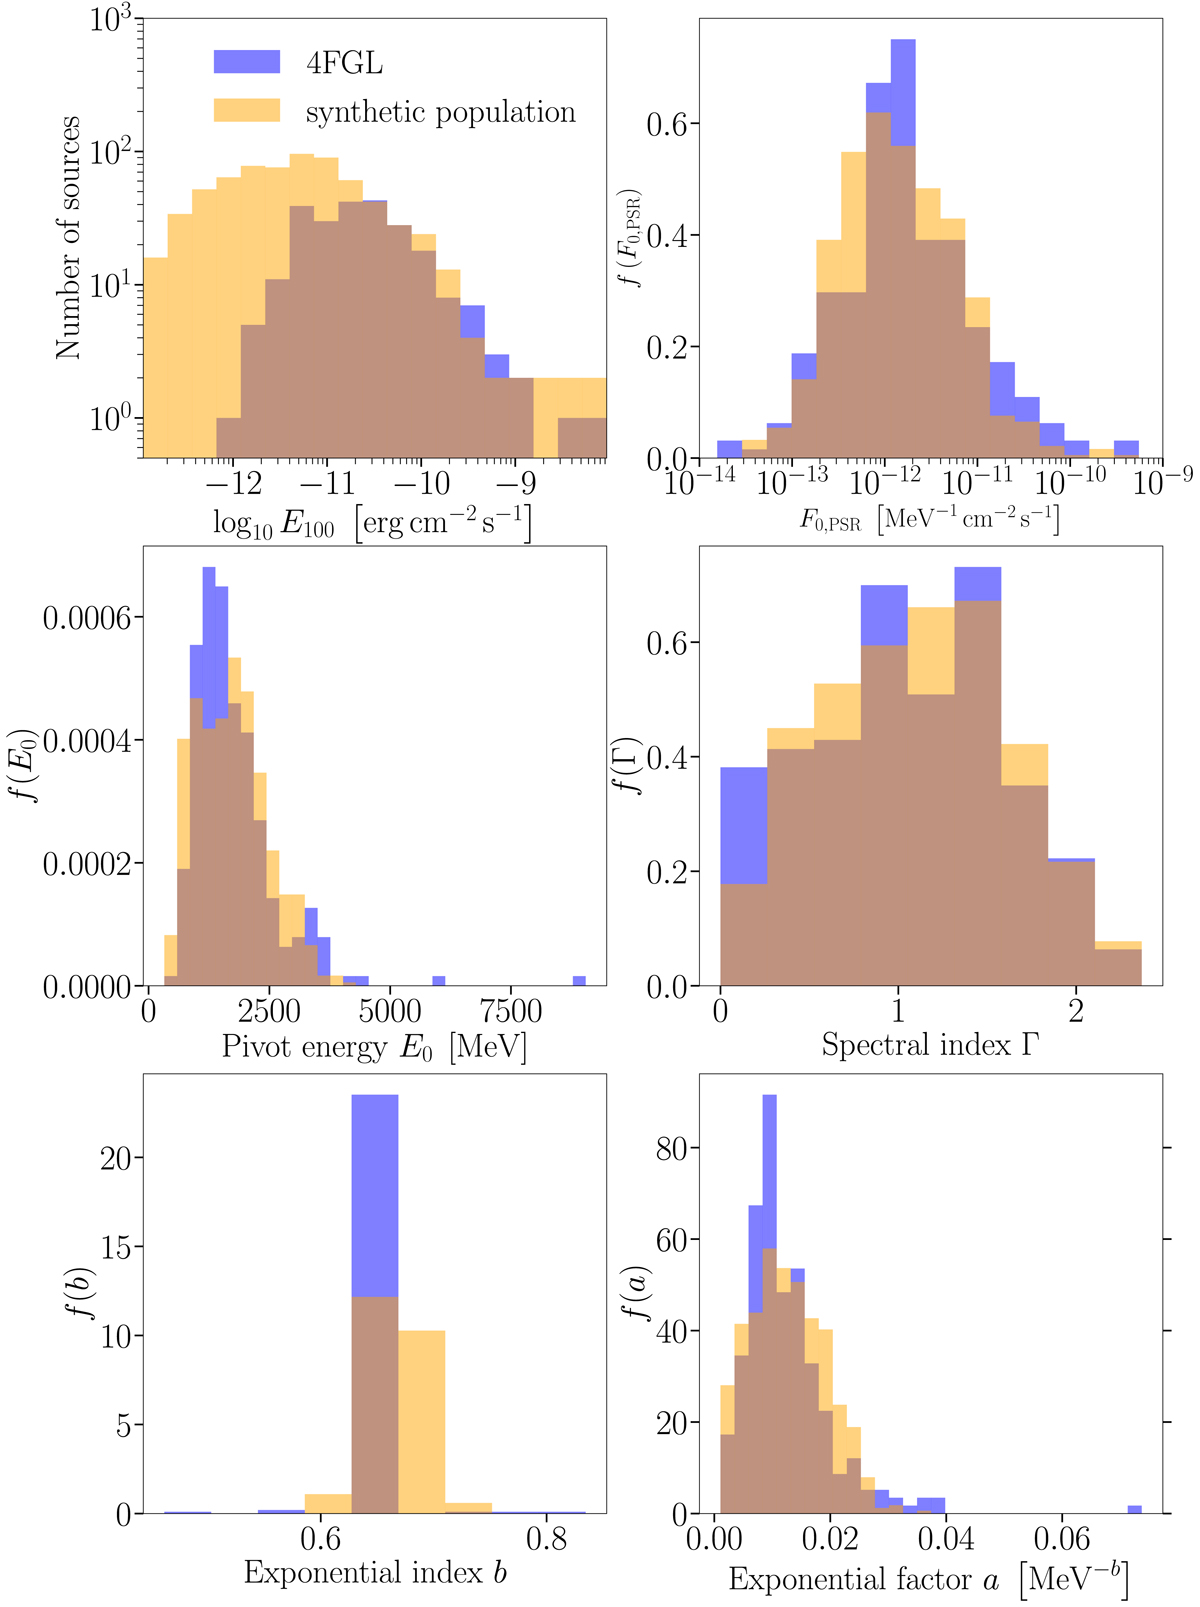
Comparison of the mock catalog’s (orange) and 4FGL’s (blue) pulsar properties with respect to four spectral parameters and the energy flux E100 within the range from 0.1 to 100 GeV. The latter quantity is displayed in the upper left panel, while the flux density F0, PSR is shown next to it. The remaining PLEC parameters are the pivot energy E0 (center left panel), the low-energy spectral slope Γ (center right panel), the exponential index b (lower left panel) and the exponential factor a (lower right panel). The y-axis of the E100-distributions is given in actual object numbers whereas the other four panels show the normalized distributions of the respective parameters.
Current usage metrics show cumulative count of Article Views (full-text article views including HTML views, PDF and ePub downloads, according to the available data) and Abstracts Views on Vision4Press platform.
Data correspond to usage on the plateform after 2015. The current usage metrics is available 48-96 hours after online publication and is updated daily on week days.
Initial download of the metrics may take a while.