Fig. 12.
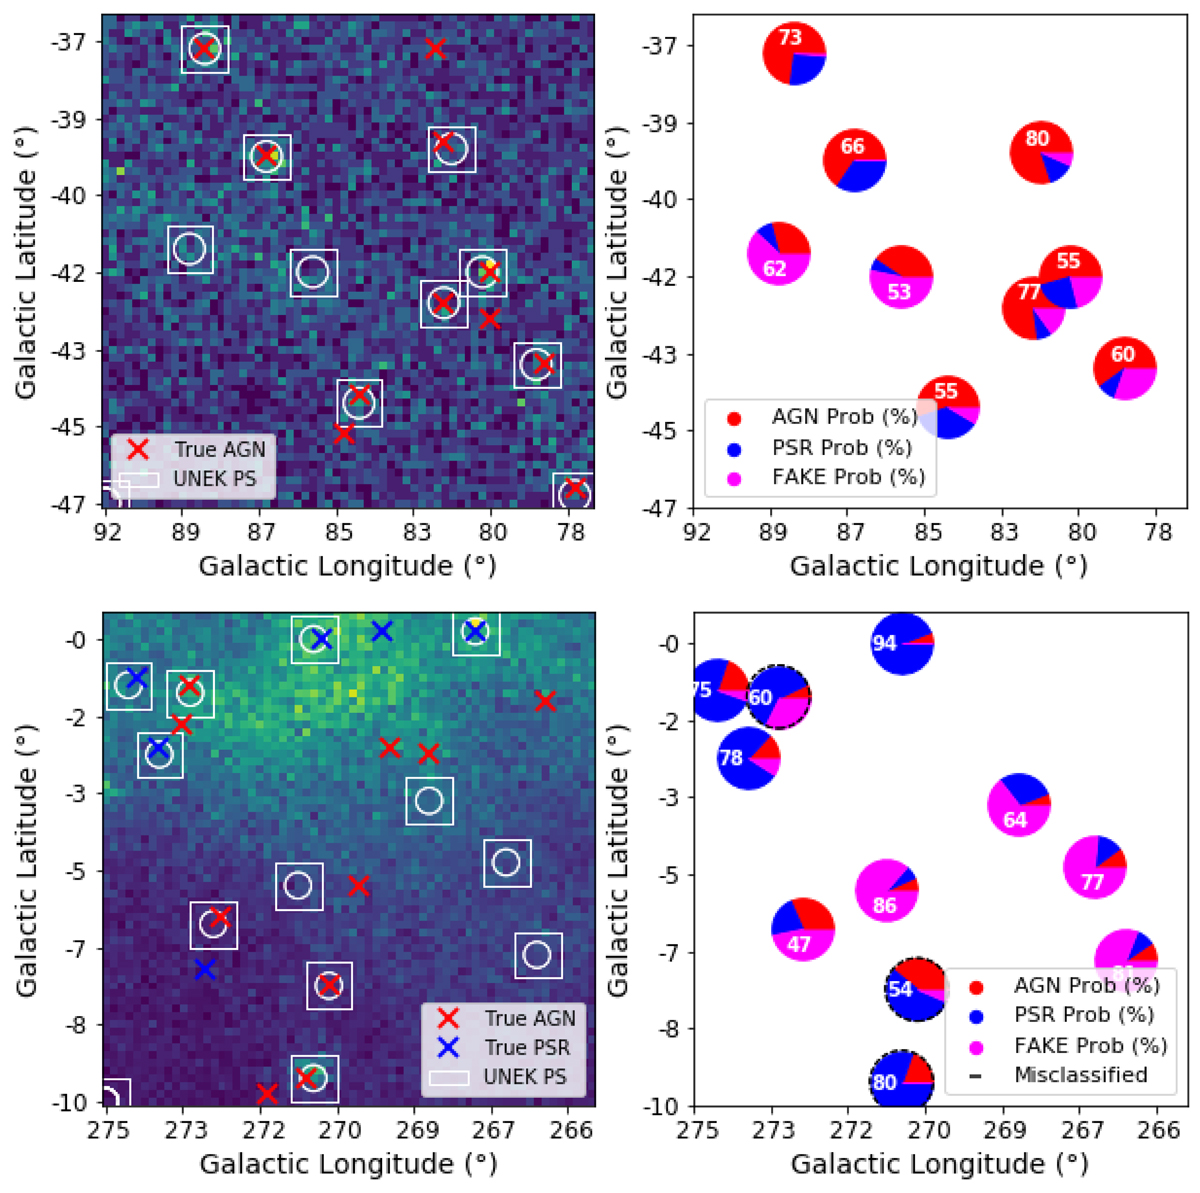
Download original image
Left: results of the point source detection by UNEK algorithm (white circles), overlaid with the original gamma-ray map in the 0.5–1 GeV energy bin. The cross marks true sources in the test data, with the color representing their true class. White squares mark the 7 × 7 pixel region that is used for source classification. Right: results of the classification algorithm are presented with colored circles, where the color represents the probability of a given predicted class. We also explicitly mark the highest probability of a given class, as output by the network. Black-dashed circle edges mark miss-classified sources. Note that the sources that appear at the edges of a patch on the left are not included in the classification procedure and are therefore missing in the right figure. The top row focuses on high latitudes, while the bottom row shows a region close to the Galactic plane.
Current usage metrics show cumulative count of Article Views (full-text article views including HTML views, PDF and ePub downloads, according to the available data) and Abstracts Views on Vision4Press platform.
Data correspond to usage on the plateform after 2015. The current usage metrics is available 48-96 hours after online publication and is updated daily on week days.
Initial download of the metrics may take a while.