Fig. 1.
Download original image
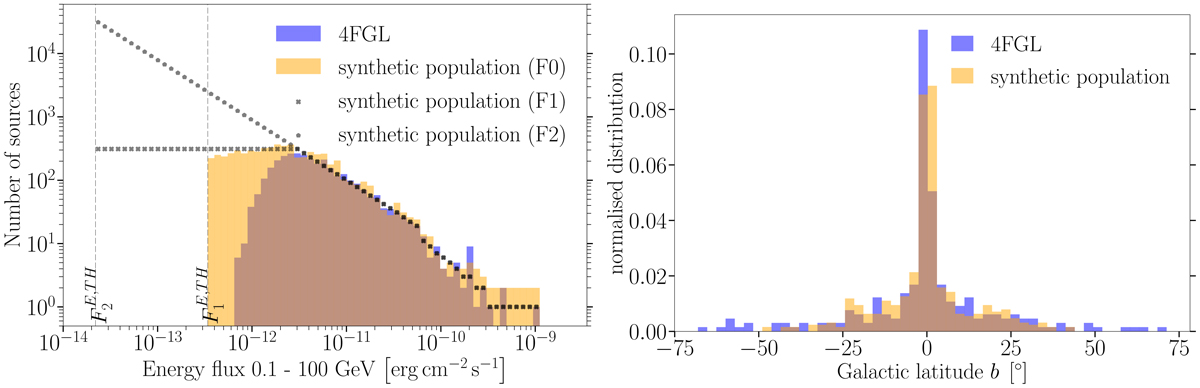
Left: comparison of the AGN dN/dFE-distributions described above. The blue histogram displays the actual distribution of 4FGL AGN-like sources whereas the orange histrogramme reflects the FL extrapolation to train the network, i.e. using a the threshold ![]() . The distribution with gray crosses shows the FL extrapolation to the lower threshold
. The distribution with gray crosses shows the FL extrapolation to the lower threshold ![]() , which we only use as a verification data set. The gray pentagons denote the distribution arising from the PL extrapolation. Right: latitude distribution of PSR sources in 4FGL (blue) and an example mock catalog of 4FGL-like PSRs (orange). We model the latitude distribution of PSRs with a double Gaussian whose parameters are given by (A1,μ1,σ1) = (0.11,0°,1.39°) for the first Gaussian and (A2,μ2,σ2) = (0.012,0°,19.2°) for the second Gaussian. The quantities A1/2 are the normalization constant of the two Gaussian distributions.
, which we only use as a verification data set. The gray pentagons denote the distribution arising from the PL extrapolation. Right: latitude distribution of PSR sources in 4FGL (blue) and an example mock catalog of 4FGL-like PSRs (orange). We model the latitude distribution of PSRs with a double Gaussian whose parameters are given by (A1,μ1,σ1) = (0.11,0°,1.39°) for the first Gaussian and (A2,μ2,σ2) = (0.012,0°,19.2°) for the second Gaussian. The quantities A1/2 are the normalization constant of the two Gaussian distributions.
Current usage metrics show cumulative count of Article Views (full-text article views including HTML views, PDF and ePub downloads, according to the available data) and Abstracts Views on Vision4Press platform.
Data correspond to usage on the plateform after 2015. The current usage metrics is available 48-96 hours after online publication and is updated daily on week days.
Initial download of the metrics may take a while.