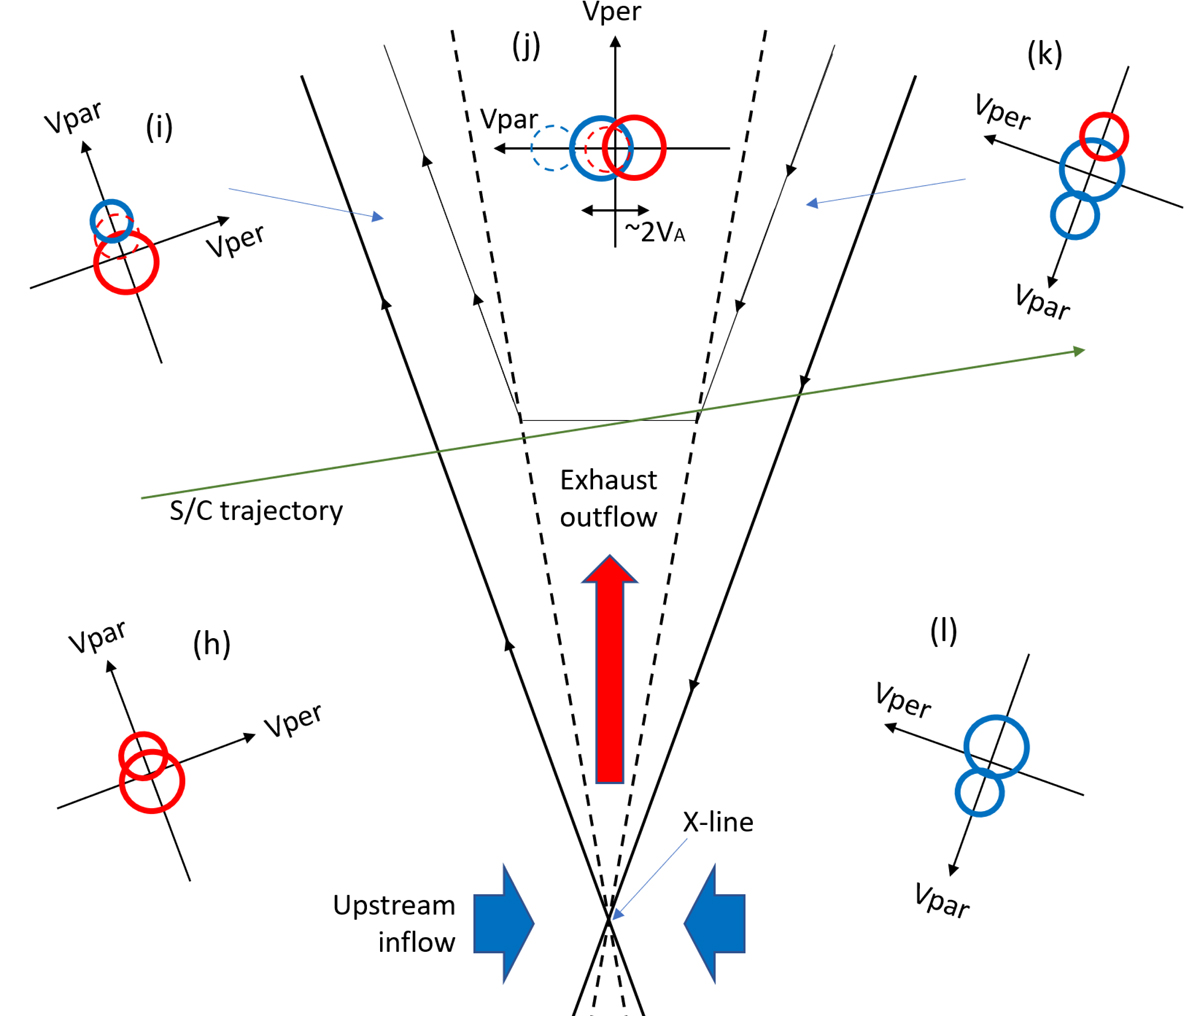
Fig. 3.
Download original image
Schematic description of the distribution functions and magnetic reconnection geometry observed in the vicinity of the event analyzed in Fig. 2. The schematic distributions are meant to be in the plasma frame, as for the distribution displayed in Fig. 2. Initial upstream proton populations are colored red and blue. Circles are used to represent the populations in phase space, and their diameter is meant to represent the intensity of the population. Their mixing in the various regions is illustrated through the use of the same color coding to identify the origin of each population. The magnetic field lines are shown with solid black lines (thick ones show the separatrices) and the exhaust boundaries (current sheets) are shown with dashed lines, thus using the same coding as for the vertical lines of Fig. 2. It should be noted that the pre-existence of beams in the upstream regions is not required for reconnection to occur, and that the exact details of the mixing of the various populations given in this figure are simplified as it does not account for kinetic behaviors that would require dedicated analysis (e.g., Cowley 1982). See text for further details.
Current usage metrics show cumulative count of Article Views (full-text article views including HTML views, PDF and ePub downloads, according to the available data) and Abstracts Views on Vision4Press platform.
Data correspond to usage on the plateform after 2015. The current usage metrics is available 48-96 hours after online publication and is updated daily on week days.
Initial download of the metrics may take a while.