Fig. 2.
Download original image
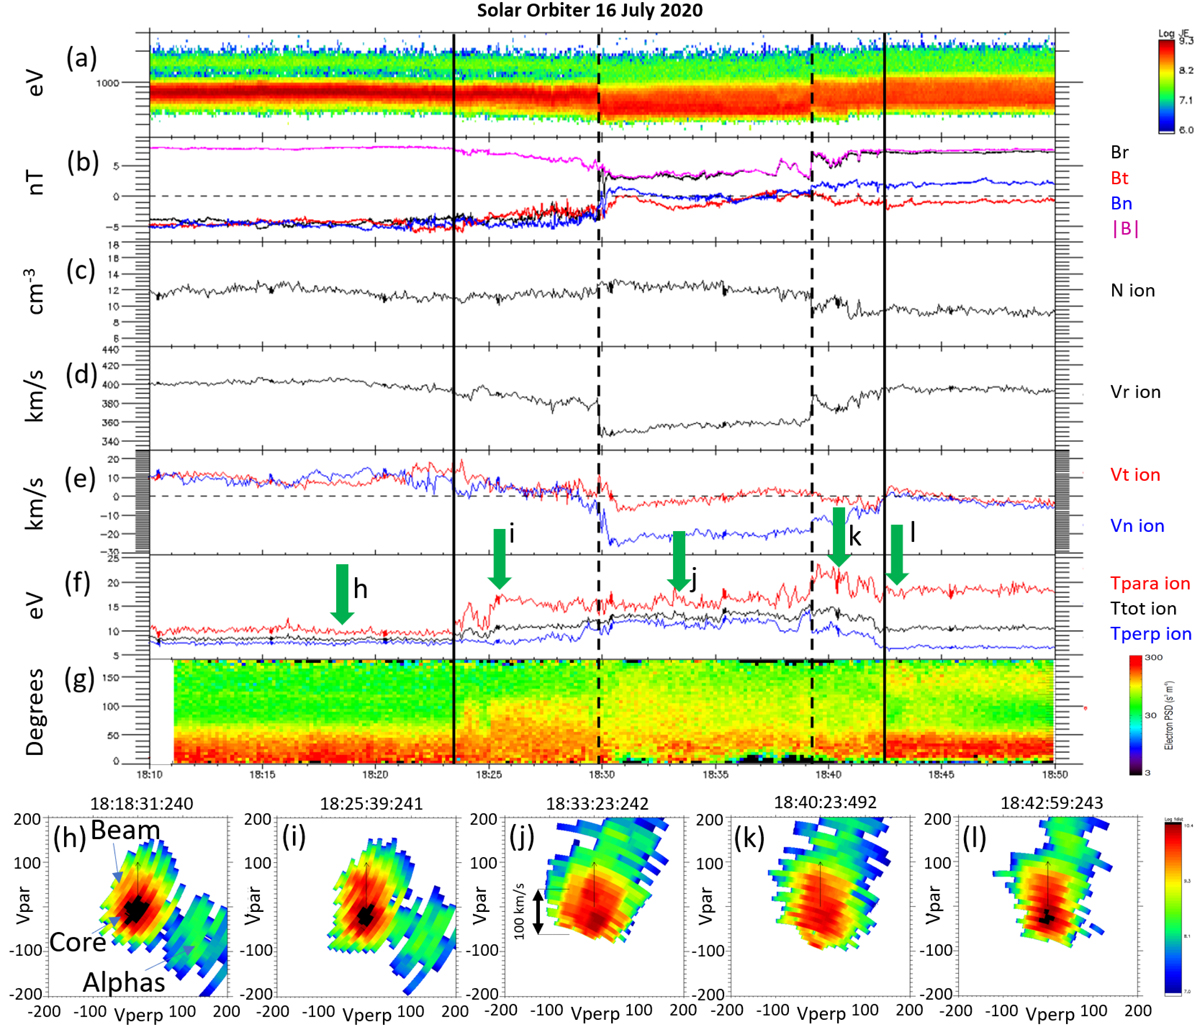
Solar Orbiter ion and magnetic field observations zoomed on the vicinity of the reconnection event around 18:35 UT on 16 July 2020 (Event 4 in Table 1). (a) Energy time spectrogram for all ions. (b) Magnetic field components and magnitude. (c) Ion density. (d) Radial ion velocity component. (e) Tangential and normal ion velocity components. (f) Parallel, perpendicular and total ion temperatures. (g) Electron pitch angle distribution above 75 eV. The reconnection exhaust (based on flows and current sheets) is located in between the vertical dashed lines. The extents of the external ion boundary layers are marked with solid vertical black lines. In panels h through l, five cuts of the ion distribution functions in the Vpar-Vperp plane are shown. Thin arrows show the magnetic field direction, which is always toward the top in such a Vpar-Vperp display. Here, Vperp is defined along the convection direction and the distributions are displayed in the plasma bulk flow frame. Corresponding times are marked with green arrows in panel f. These are characteristic ion distribution functions for each interval shown, as detailed in the text. In distribution (h), the locations of the proton core, proton beam, and alpha populations are highlighted for clarity. The phase space density is displayed with the same color scale for all distributions.
Current usage metrics show cumulative count of Article Views (full-text article views including HTML views, PDF and ePub downloads, according to the available data) and Abstracts Views on Vision4Press platform.
Data correspond to usage on the plateform after 2015. The current usage metrics is available 48-96 hours after online publication and is updated daily on week days.
Initial download of the metrics may take a while.