Free Access
Fig. 2.
Download original image
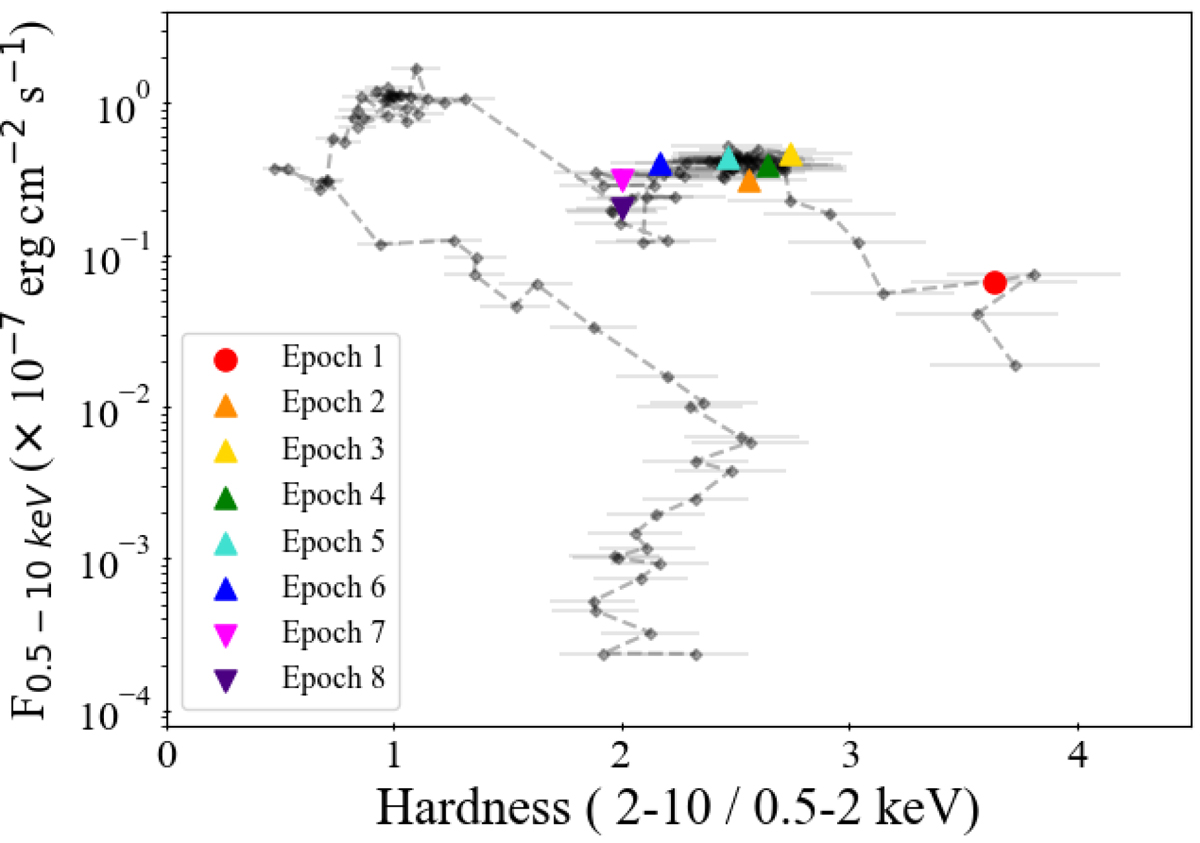
XRT HID of the source during the entire outburst. The epochs used in this work are highlighted by the colors and different symbols (Sect. 4.2), i.e., circle for phase 1 (rise), upper triangles for phase 2 (plateau) and lower triangles for phase 3 (decline).
Current usage metrics show cumulative count of Article Views (full-text article views including HTML views, PDF and ePub downloads, according to the available data) and Abstracts Views on Vision4Press platform.
Data correspond to usage on the plateform after 2015. The current usage metrics is available 48-96 hours after online publication and is updated daily on week days.
Initial download of the metrics may take a while.