Fig. A.1.
Download original image
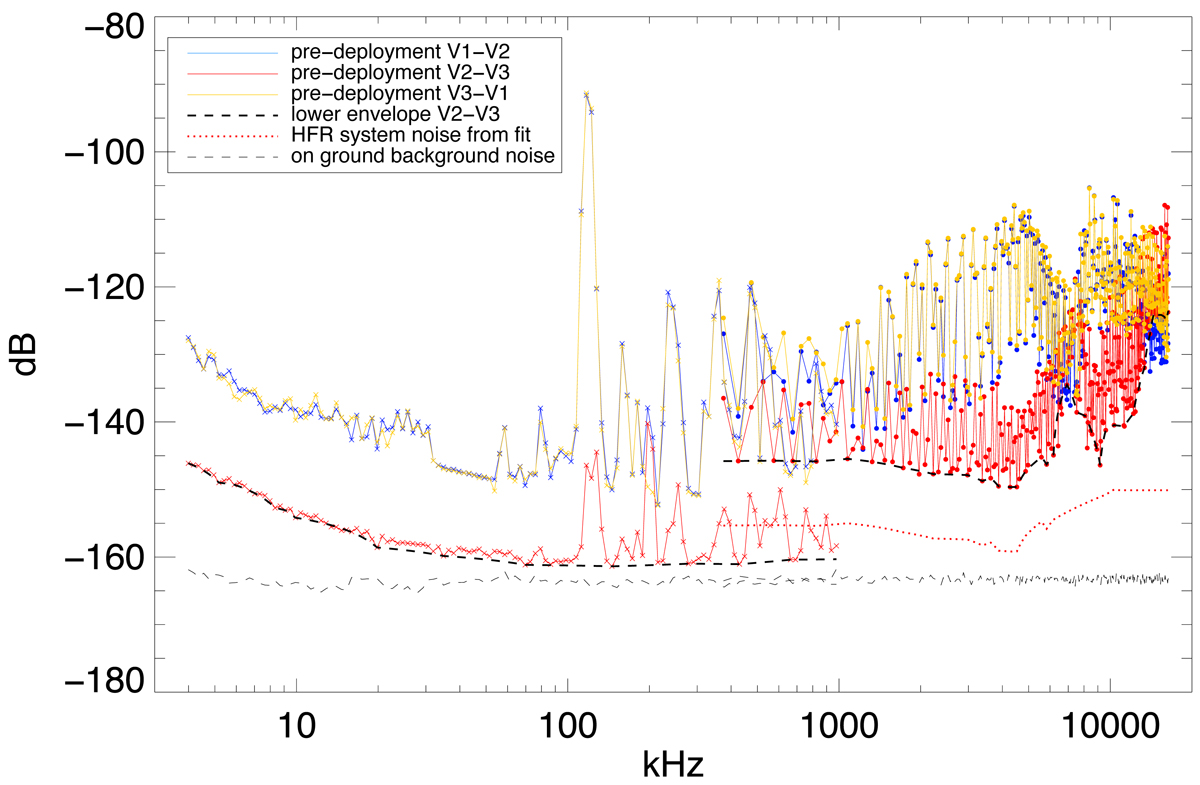
Measurements of the pre-deployment voltage spectral density (in dB) of TNR (crosses) and HFR (dots) to evaluate the receivers system noise for the three dipole sensors V1-V2 (blue), V2-V3 (red) and V3-V1 (orange). Thick black dashed lines correspond to the lower envelope of the background spectral density representing the reference receiver pre-deployment background. Thin black dashed lines correspond to the background noise measured during the on-ground tests in Meudon and including the effects of the preamplifiers. The red dotted line indicates the HFR system noise obtained after the fitting procedure described in Sect. A.2.
Current usage metrics show cumulative count of Article Views (full-text article views including HTML views, PDF and ePub downloads, according to the available data) and Abstracts Views on Vision4Press platform.
Data correspond to usage on the plateform after 2015. The current usage metrics is available 48-96 hours after online publication and is updated daily on week days.
Initial download of the metrics may take a while.