Open Access
Fig. 8.
Download original image
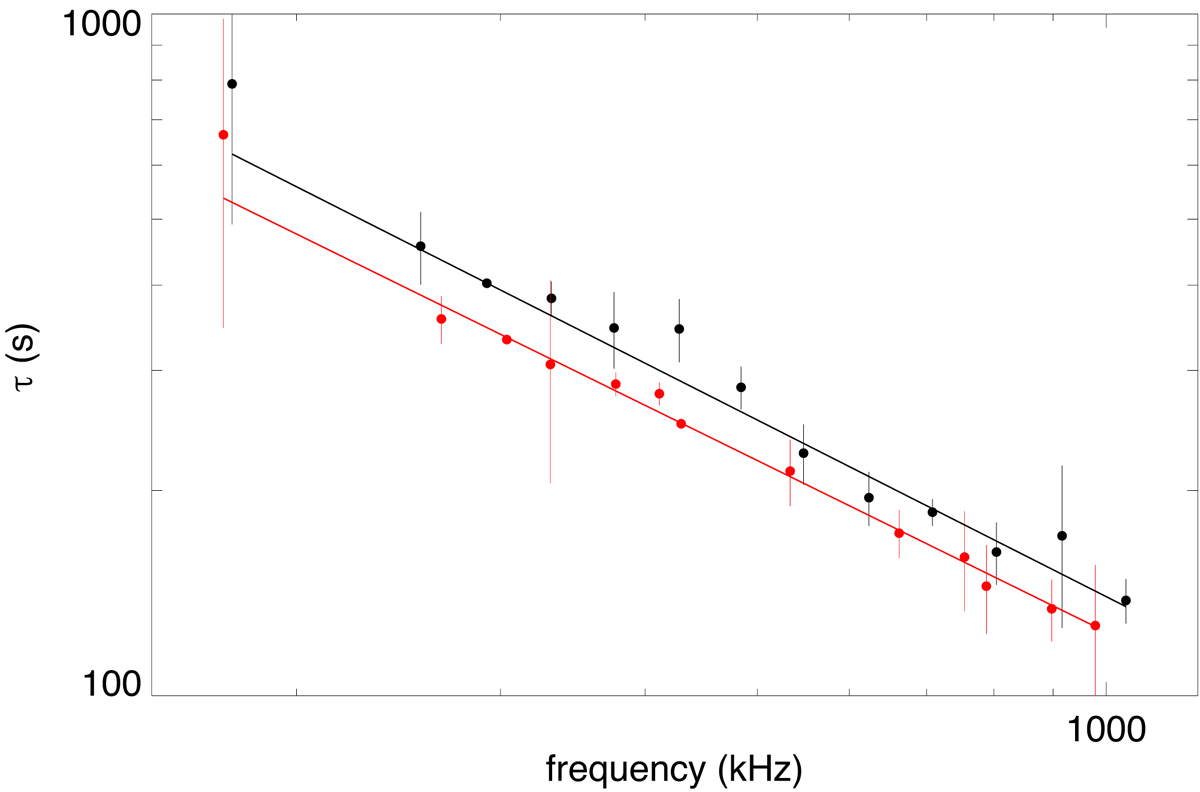
Median values of τ for SO (red) and Wind (black) as a function of frequency. Error bars represent the 25th and 75th percentiles. The black and red lines represent the results of power-law fitting from Eq. (15).
Current usage metrics show cumulative count of Article Views (full-text article views including HTML views, PDF and ePub downloads, according to the available data) and Abstracts Views on Vision4Press platform.
Data correspond to usage on the plateform after 2015. The current usage metrics is available 48-96 hours after online publication and is updated daily on week days.
Initial download of the metrics may take a while.