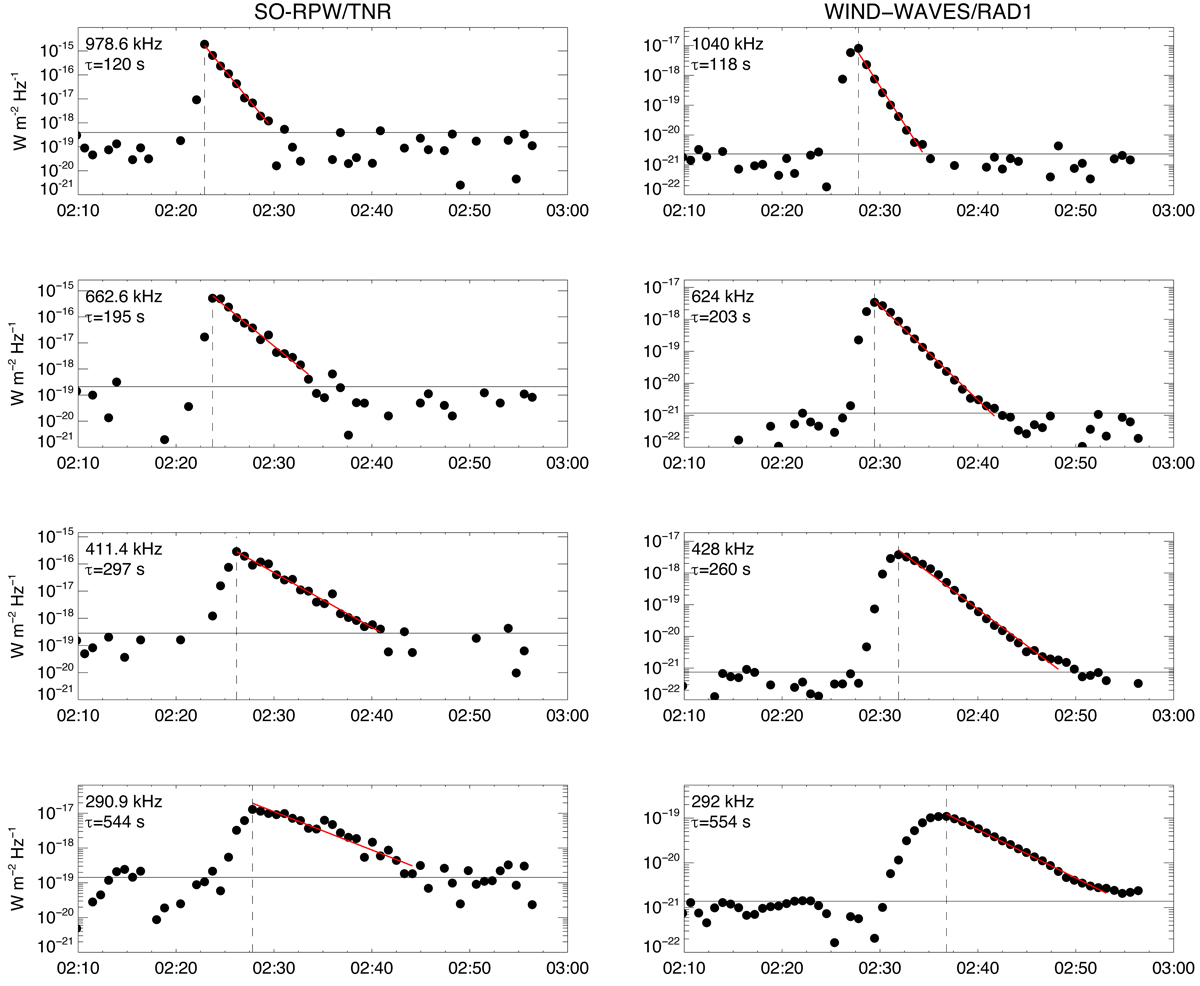
Fig. 6.
Download original image
Radio measurements of the 2020 July 11 type III burst. Light curves of the radio flux density measured by SO-RPW/TNR (left column) and Wind-Waves/RAD1 (right column) at four frequency channels. The red line shows the results of decay time fitting. The dashed vertical line indicates the peak fluxes and the horizontal line shows the median value.
Current usage metrics show cumulative count of Article Views (full-text article views including HTML views, PDF and ePub downloads, according to the available data) and Abstracts Views on Vision4Press platform.
Data correspond to usage on the plateform after 2015. The current usage metrics is available 48-96 hours after online publication and is updated daily on week days.
Initial download of the metrics may take a while.