Fig. 3.
Download original image
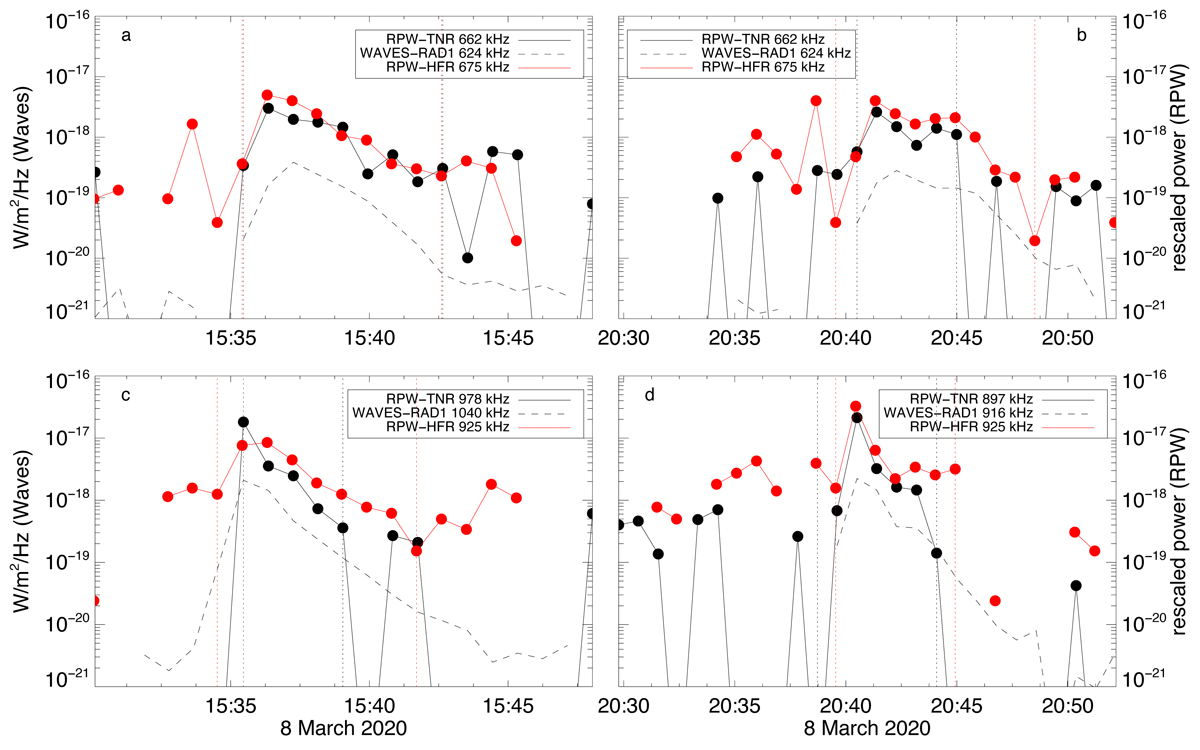
Comparison between SB-Wind (dashed lines) in W m−2 Hz−1, as obtained by Waves-RAD1, and ![]() (solid lines), as measured by RPW and rescaled by a factor 2/Z0 for RPW-TNR (black) and RPW-HFR (red) and for the V1-V2 dipole. Vertical dotted lines delimit the data points used to calculate Γleff. Panels a, c, and b, d refer to the two type III emissions detected on March 8, 2020, respectively.
(solid lines), as measured by RPW and rescaled by a factor 2/Z0 for RPW-TNR (black) and RPW-HFR (red) and for the V1-V2 dipole. Vertical dotted lines delimit the data points used to calculate Γleff. Panels a, c, and b, d refer to the two type III emissions detected on March 8, 2020, respectively.
Current usage metrics show cumulative count of Article Views (full-text article views including HTML views, PDF and ePub downloads, according to the available data) and Abstracts Views on Vision4Press platform.
Data correspond to usage on the plateform after 2015. The current usage metrics is available 48-96 hours after online publication and is updated daily on week days.
Initial download of the metrics may take a while.