Fig. A.6.
Download original image
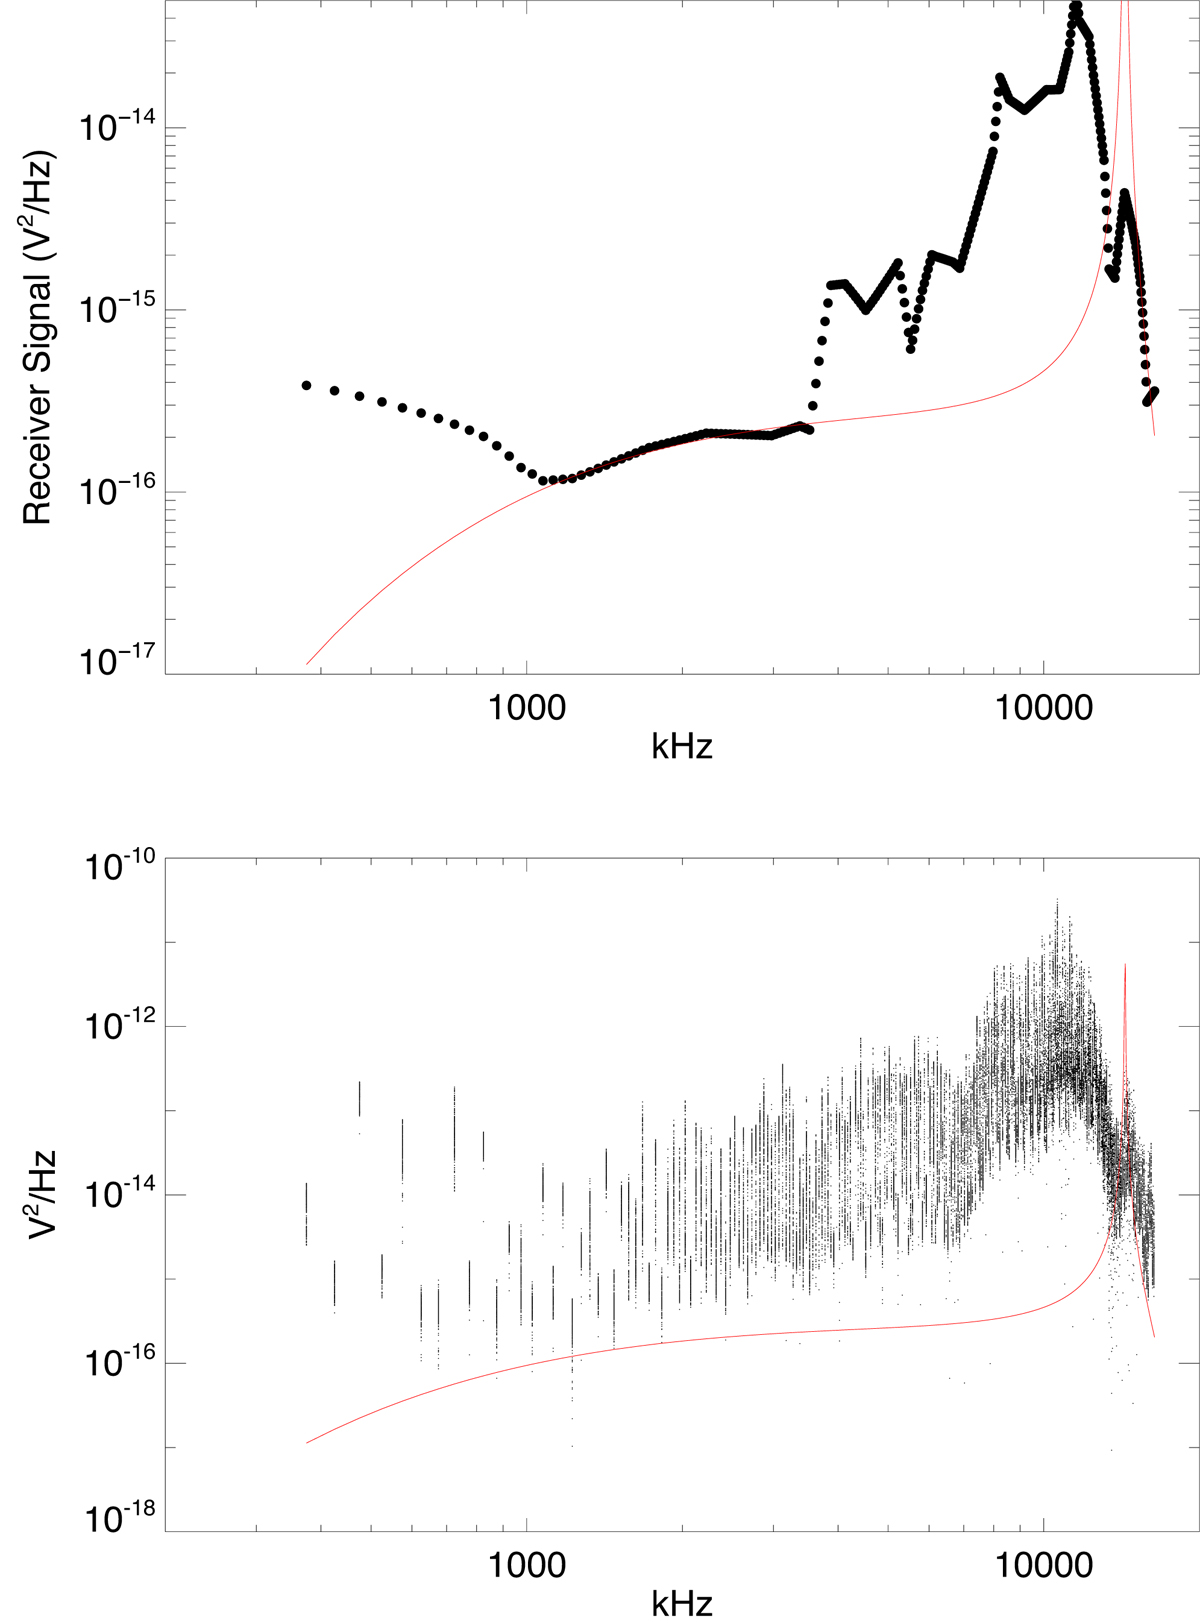
Comparison of the measured receiver power spectral density with the theoretical received power. Upper: ![]() for the sensor V1-V2, as a function of the frequency, calculated from the minimum background. Black dots represent the data points. Lower: daily minima of the HFR
for the sensor V1-V2, as a function of the frequency, calculated from the minimum background. Black dots represent the data points. Lower: daily minima of the HFR ![]() spectra minus
spectra minus ![]() as a function of the frequency, over the time span March 1-December 31, 2020 for the sensor V1-V2. Red solid line represents the theoretical receiver power, expected for the model Novaco & Brown (1978), as obtained from Equations (8), (A.1),(A.2) using Γleff = 3.4 ± 0.1 m (from the galactic background measurements). The increase of the measured voltage spectral power at frequencies above 4 MHz is the consequence of the antenna resonance.
as a function of the frequency, over the time span March 1-December 31, 2020 for the sensor V1-V2. Red solid line represents the theoretical receiver power, expected for the model Novaco & Brown (1978), as obtained from Equations (8), (A.1),(A.2) using Γleff = 3.4 ± 0.1 m (from the galactic background measurements). The increase of the measured voltage spectral power at frequencies above 4 MHz is the consequence of the antenna resonance.
Current usage metrics show cumulative count of Article Views (full-text article views including HTML views, PDF and ePub downloads, according to the available data) and Abstracts Views on Vision4Press platform.
Data correspond to usage on the plateform after 2015. The current usage metrics is available 48-96 hours after online publication and is updated daily on week days.
Initial download of the metrics may take a while.