Open Access
Fig. A.5.
Download original image
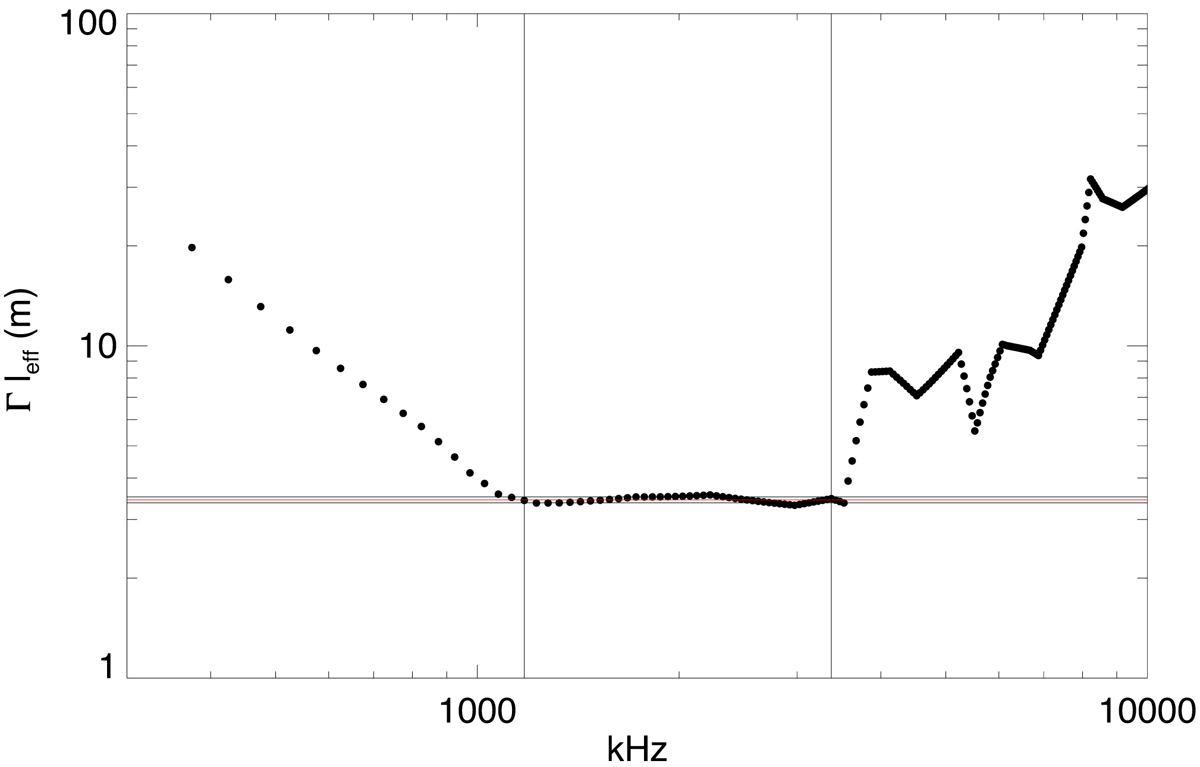
Depiction of the right-hand side of Equation (A.2) as a function of the frequency. The horizontal lines show the mean value (red) and 1σ uncertainties (black) calculated in the frequency range between the two dashed vertical lines for the minimum χ2 fit.
Current usage metrics show cumulative count of Article Views (full-text article views including HTML views, PDF and ePub downloads, according to the available data) and Abstracts Views on Vision4Press platform.
Data correspond to usage on the plateform after 2015. The current usage metrics is available 48-96 hours after online publication and is updated daily on week days.
Initial download of the metrics may take a while.