Open Access
Fig. A.3.
Download original image
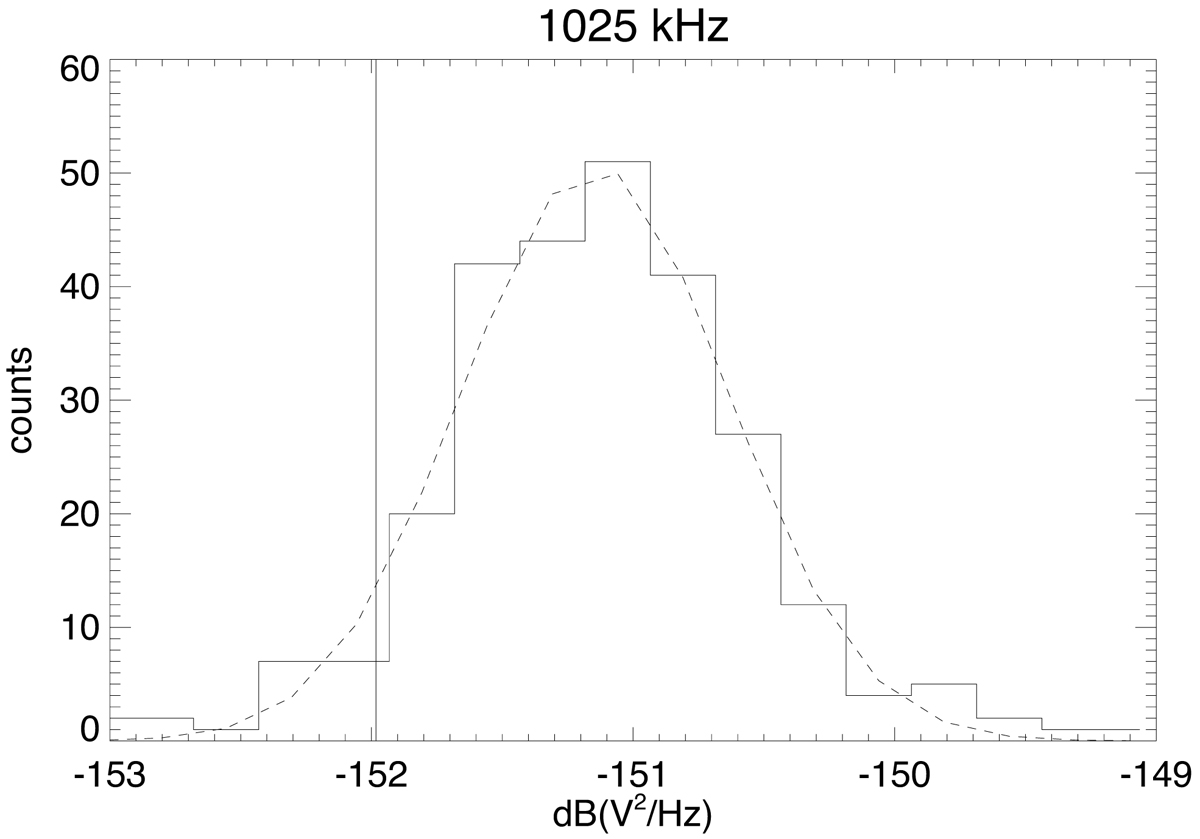
Histogram of the minima values in the period between March 1 and December 31, 2020 at the frequency of 1.025 MHz. The gaussian distribution (dashed) corresponds to the Galactic signal plus the system noise and their fluctuations at this frequency. The vertical line indicates the limit of the lower 5% occurrence level.
Current usage metrics show cumulative count of Article Views (full-text article views including HTML views, PDF and ePub downloads, according to the available data) and Abstracts Views on Vision4Press platform.
Data correspond to usage on the plateform after 2015. The current usage metrics is available 48-96 hours after online publication and is updated daily on week days.
Initial download of the metrics may take a while.