Open Access
Fig. A.2.
Download original image
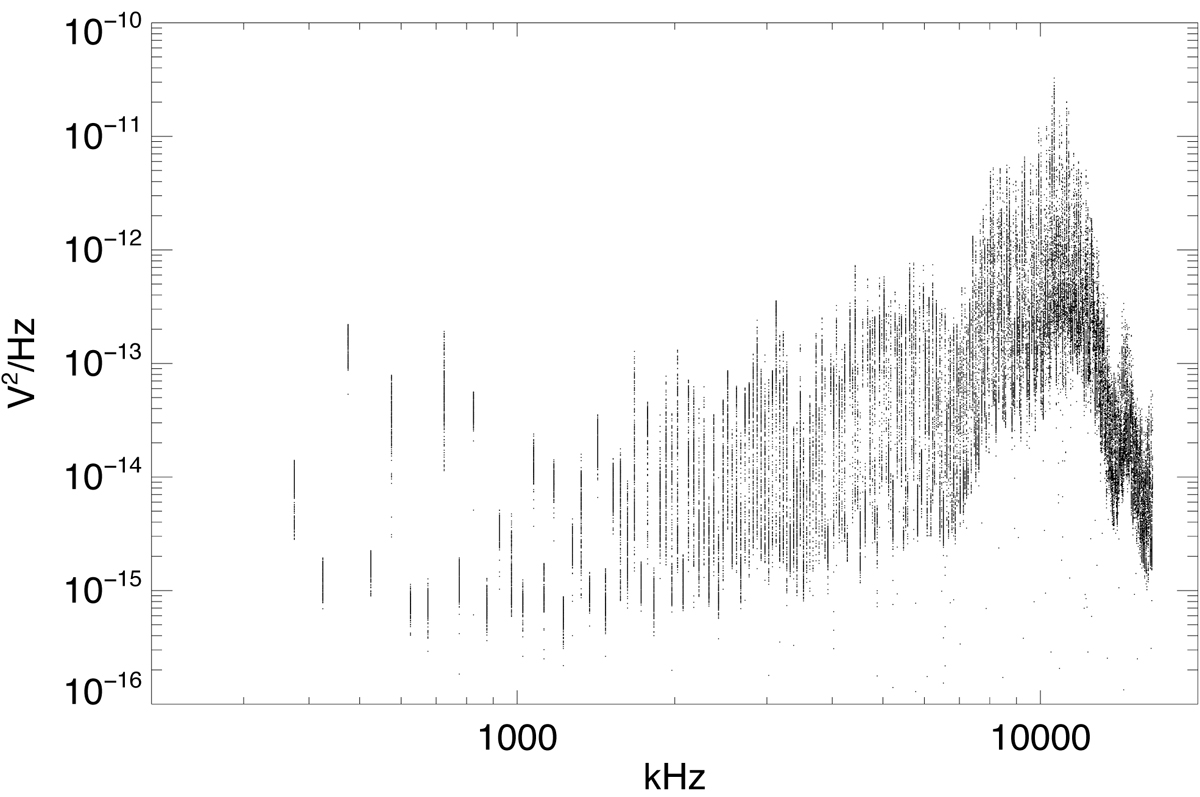
Daily minima of the HFR spectra over the time span from March 1 to December 31, 2020 for the sensor V1-V2 as a function of the frequency.
Current usage metrics show cumulative count of Article Views (full-text article views including HTML views, PDF and ePub downloads, according to the available data) and Abstracts Views on Vision4Press platform.
Data correspond to usage on the plateform after 2015. The current usage metrics is available 48-96 hours after online publication and is updated daily on week days.
Initial download of the metrics may take a while.