Open Access
Fig. 1.
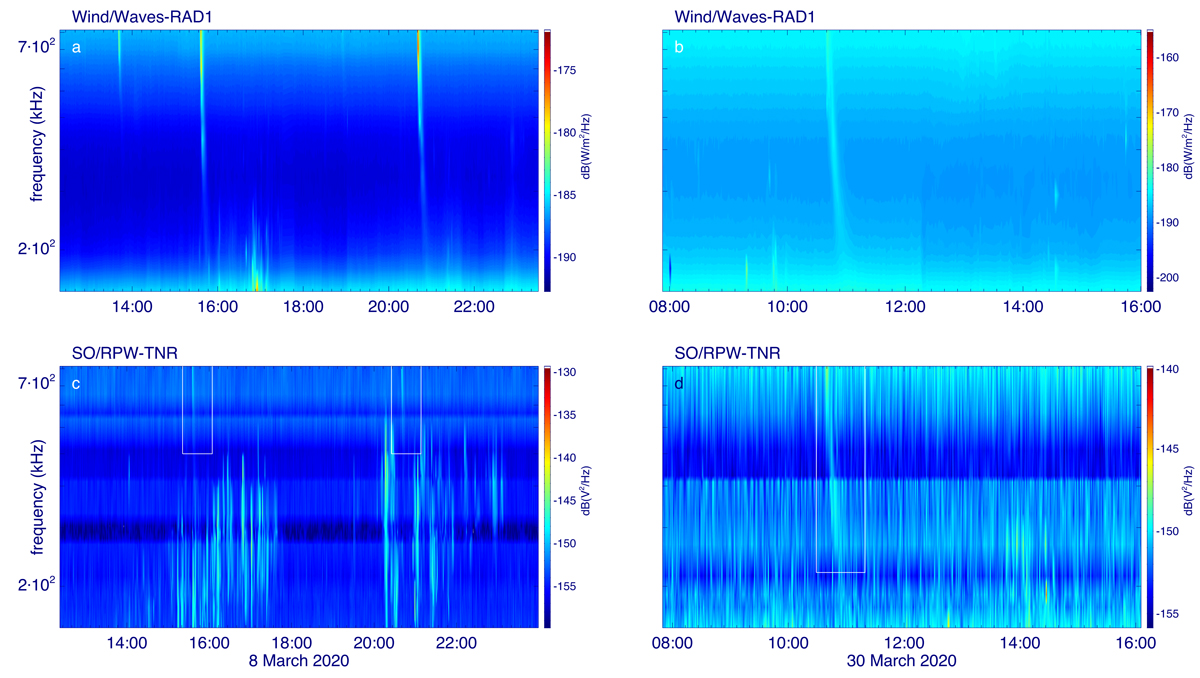
Download original image
Dynamic spectra from Wind/Waves-RAD1 (upper panels) and SO/RPW-TNR (dipole V1-V2, lower panels) for March 8 (a, c) and March 30, (b, d) 2020. White boxes underline the type III occurrence on the RPW data. The color tables are in dB, calculated from W2 m−2 Hz−1 for Wind and V2 Hz−1 for RPW.
Current usage metrics show cumulative count of Article Views (full-text article views including HTML views, PDF and ePub downloads, according to the available data) and Abstracts Views on Vision4Press platform.
Data correspond to usage on the plateform after 2015. The current usage metrics is available 48-96 hours after online publication and is updated daily on week days.
Initial download of the metrics may take a while.