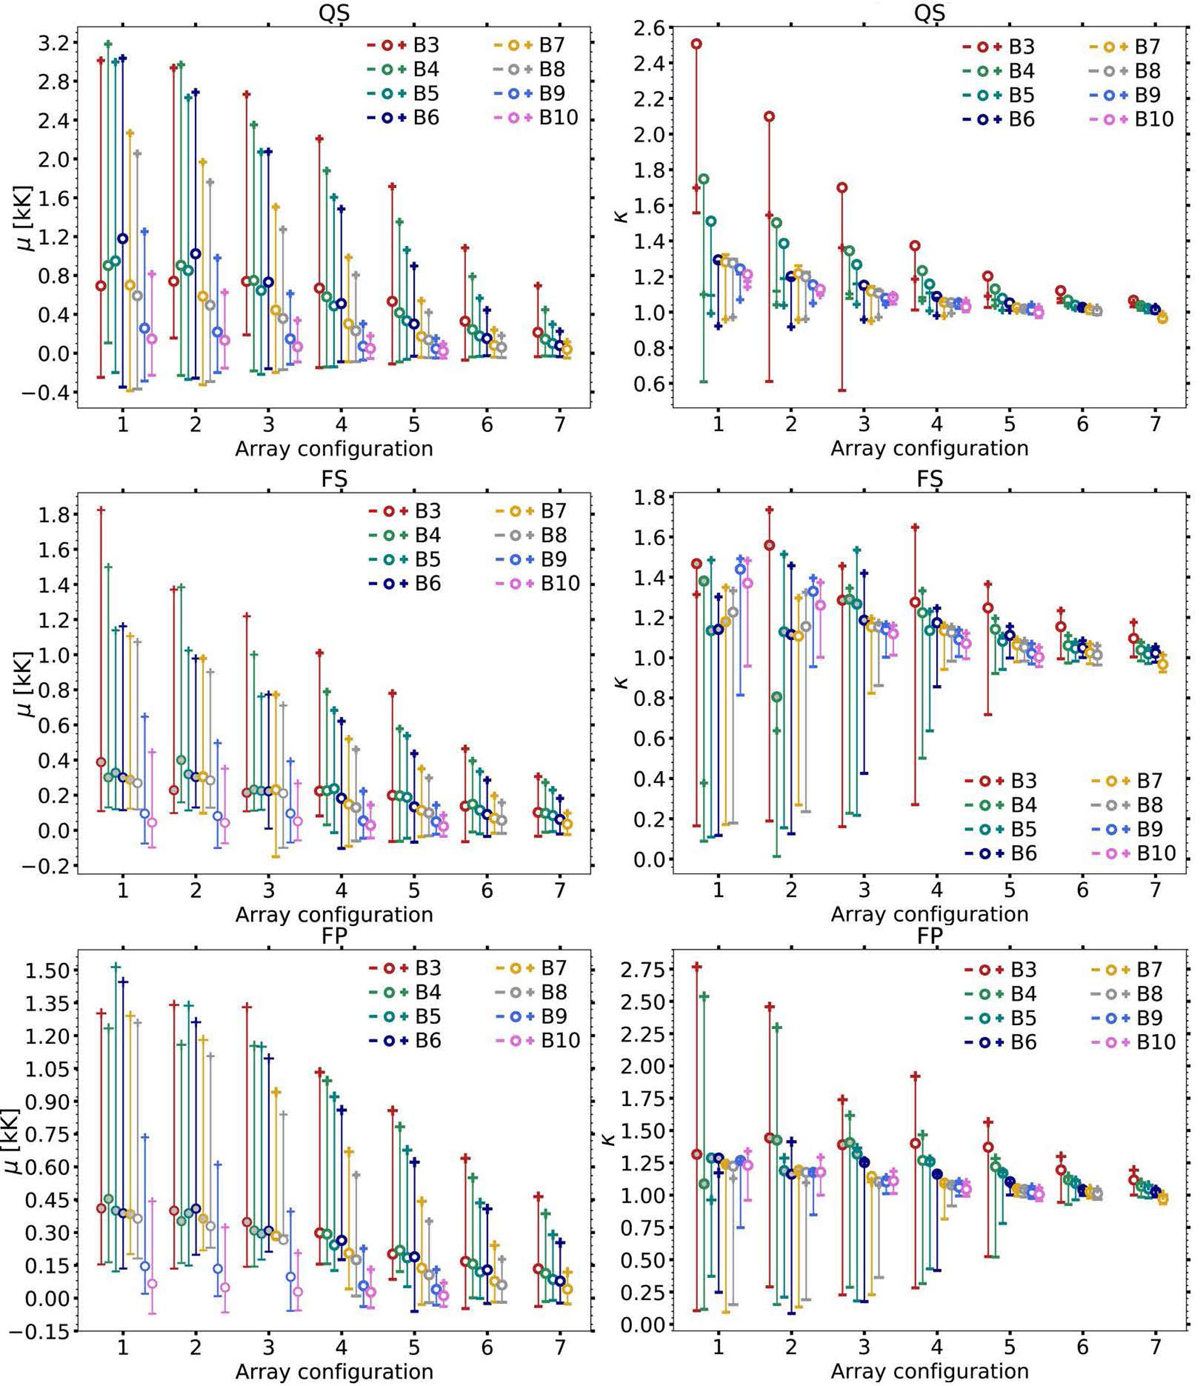
Fig. 8.
Download original image
Parameters of linear fits for Eq. (3) to the brightness temperature excess density plots (as in Fig. 7). All combinations of spectral bands 3–10 and array configurations C1–C7 are given for the three selected regions, QS (upper row), FS (middle row), and FP (bottom row). The linear fits across the bins to the median values are indicated by the circles and to plus and minus one standard deviation are marked with plus and minus signs, respectively. Left column: μ, indicates the scalar shift of Tb, and the right column, κ, indicates the slope of the linear fit. The cases in which the most intense brightening instances are dominated by apparent brightening are marked with filled gray circles.
Current usage metrics show cumulative count of Article Views (full-text article views including HTML views, PDF and ePub downloads, according to the available data) and Abstracts Views on Vision4Press platform.
Data correspond to usage on the plateform after 2015. The current usage metrics is available 48-96 hours after online publication and is updated daily on week days.
Initial download of the metrics may take a while.