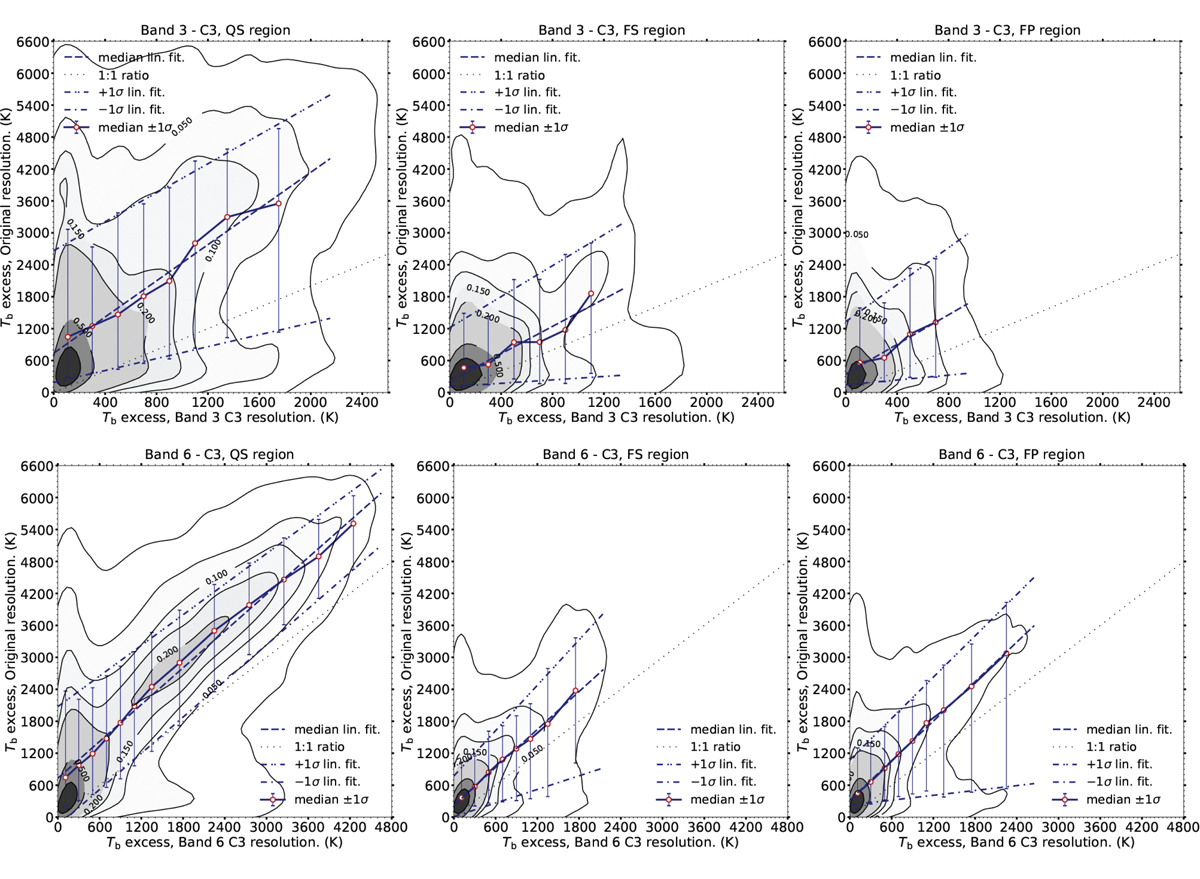
Fig. 7.
Download original image
Degradation of brightening events in band 3 (top row) and band 6 (bottom row), with the respective spatial resolution corresponding to array configuration C3. The Tb excess of brightening events at the original resolution plotted against the Tb excess at degraded resolution. The contour lines show the levels of 0.01, 0.05, 0.1, 0.15, 0.2, 0.5, and 0.75 of the density plot. The circles connected by the solid line show the median values (50th percentile) for the respective bin, and their error bars indicate plus and minus 1σ (e.g., 84th and 16th percentile). The dashed line marks a linear fit to the median values, and the dash-dotted lines mark linear fits to the ±1σ values. The dotted line marks the ratio of one-to-one for reference.
Current usage metrics show cumulative count of Article Views (full-text article views including HTML views, PDF and ePub downloads, according to the available data) and Abstracts Views on Vision4Press platform.
Data correspond to usage on the plateform after 2015. The current usage metrics is available 48-96 hours after online publication and is updated daily on week days.
Initial download of the metrics may take a while.