Fig. 6.
Download original image
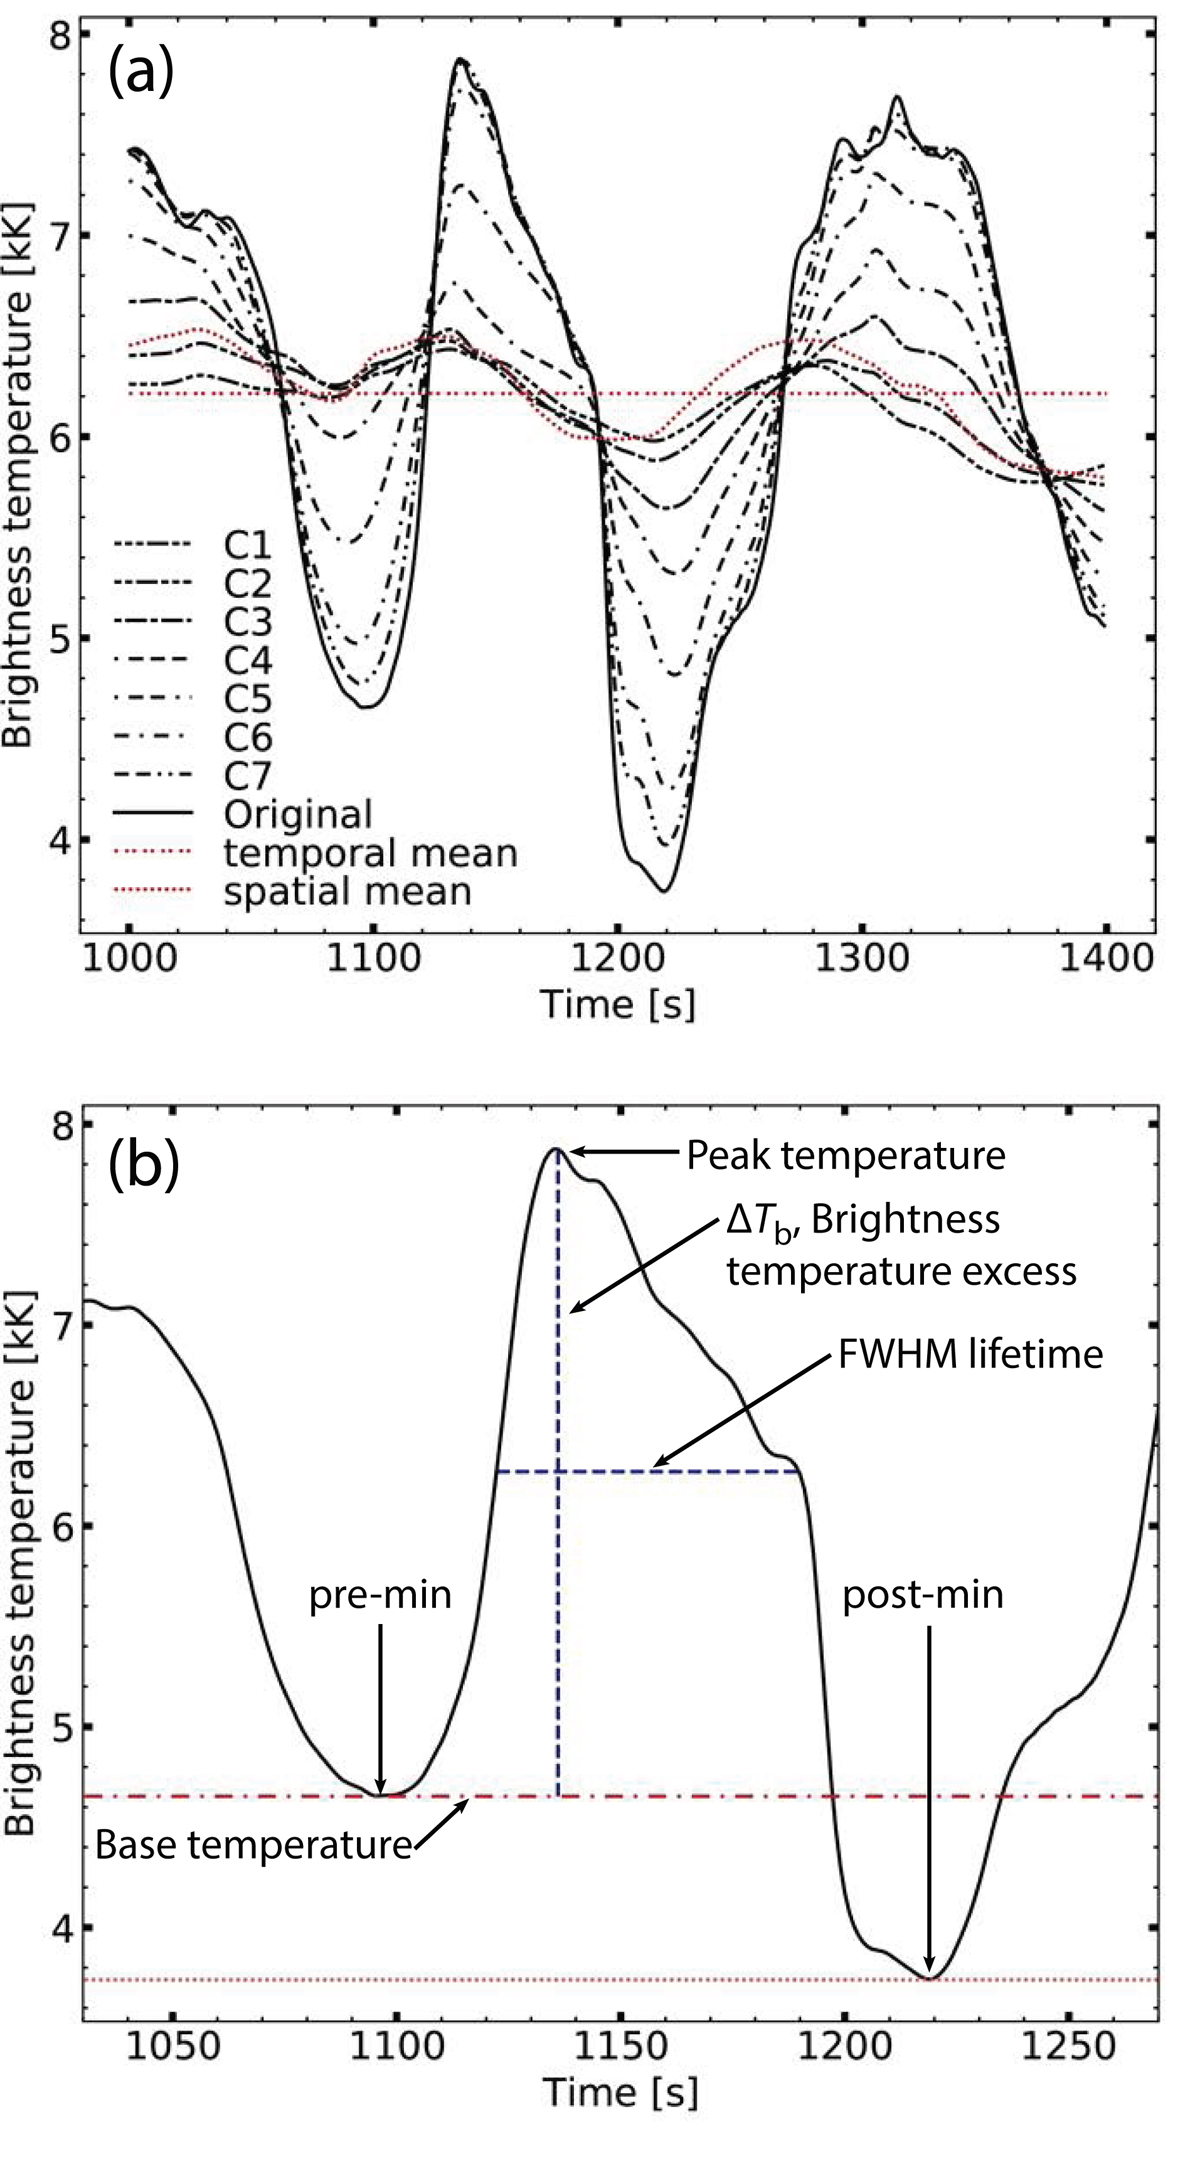
Example of the degradation of Tb excess of a transient brightening event caused by limited spatial resolution and selection criteria for Tb excess. (a) The time evolution of the brightness temperature at (x, y) = (−14″8, 13″1) in wavelengths of band 3 (cf. Table 1) is given for the map with original resolution (solid line) and for the spatially degraded maps corresponding to the respective array configuration. The dotted horizontal line marks the mean Tb value of the displayed time series at the original resolution, and the second dotted line shows the time evolution of the spatial mean value over a square of about 5 arcsecondse centered on the selected location. (b) Illustration of the selection criteria for the dynamic events. For each peak in the temporal evolution of the brightness temperature, the local pre- and post-minima are found. The base temperature for the specific event (horizontal dash-dotted red line) is defined as the temperature of the local minima with highest temperature, and the corresponding Tb excess of the event (vertical dashed blue line) is the difference between the peak temperature and the base temperature. The FWHM of the peak (horizontal dashed blue line) shows the lifetime of the brightening event.
Current usage metrics show cumulative count of Article Views (full-text article views including HTML views, PDF and ePub downloads, according to the available data) and Abstracts Views on Vision4Press platform.
Data correspond to usage on the plateform after 2015. The current usage metrics is available 48-96 hours after online publication and is updated daily on week days.
Initial download of the metrics may take a while.