Fig. 5.
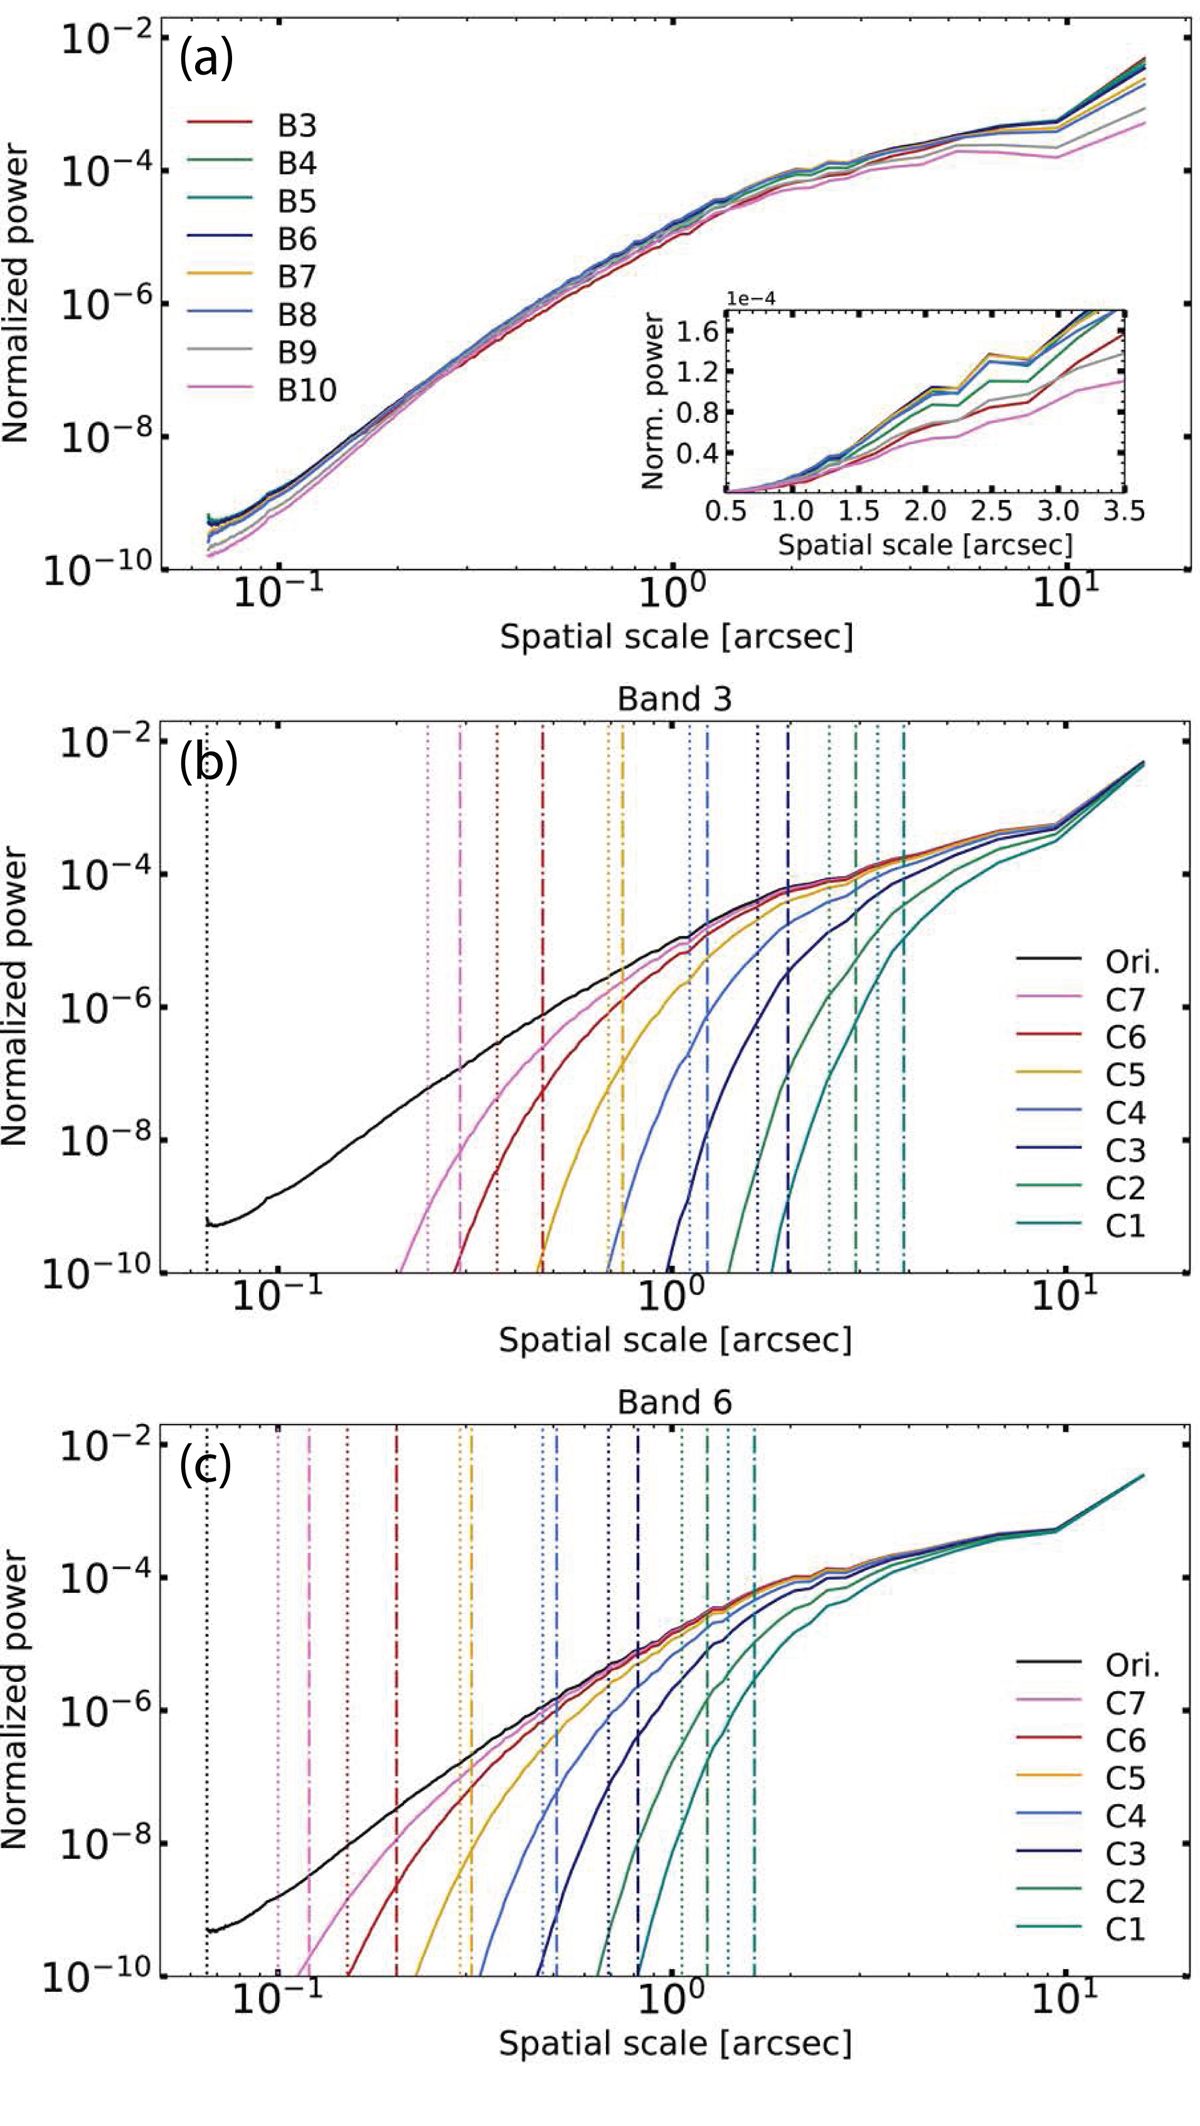
Download original image
Spatial power spectra. (a) Spatial power spectra of all bands at the original resolution, averaged over the entire FOV and between t = 1550 − 1750 s. The inset shows a zoom-in between spatial scales of 0.5 − 3.5 arcsec, with the power on a linear scale. (b) and (c) Spatial power spectra of bands 3 and 6 at the original resolution and the resolutions corresponding to array configurations C1–C7 for each band. The FWHMs of the minor and major axes of the corresponding clean beams are marked with the vertical dotted and dot-dashed lines, respectively. For reference, the cell size of the numerical model (at 0.066 arcsec) is marked by the vertical dotted black lines.
Current usage metrics show cumulative count of Article Views (full-text article views including HTML views, PDF and ePub downloads, according to the available data) and Abstracts Views on Vision4Press platform.
Data correspond to usage on the plateform after 2015. The current usage metrics is available 48-96 hours after online publication and is updated daily on week days.
Initial download of the metrics may take a while.