Fig. 3.
Download original image
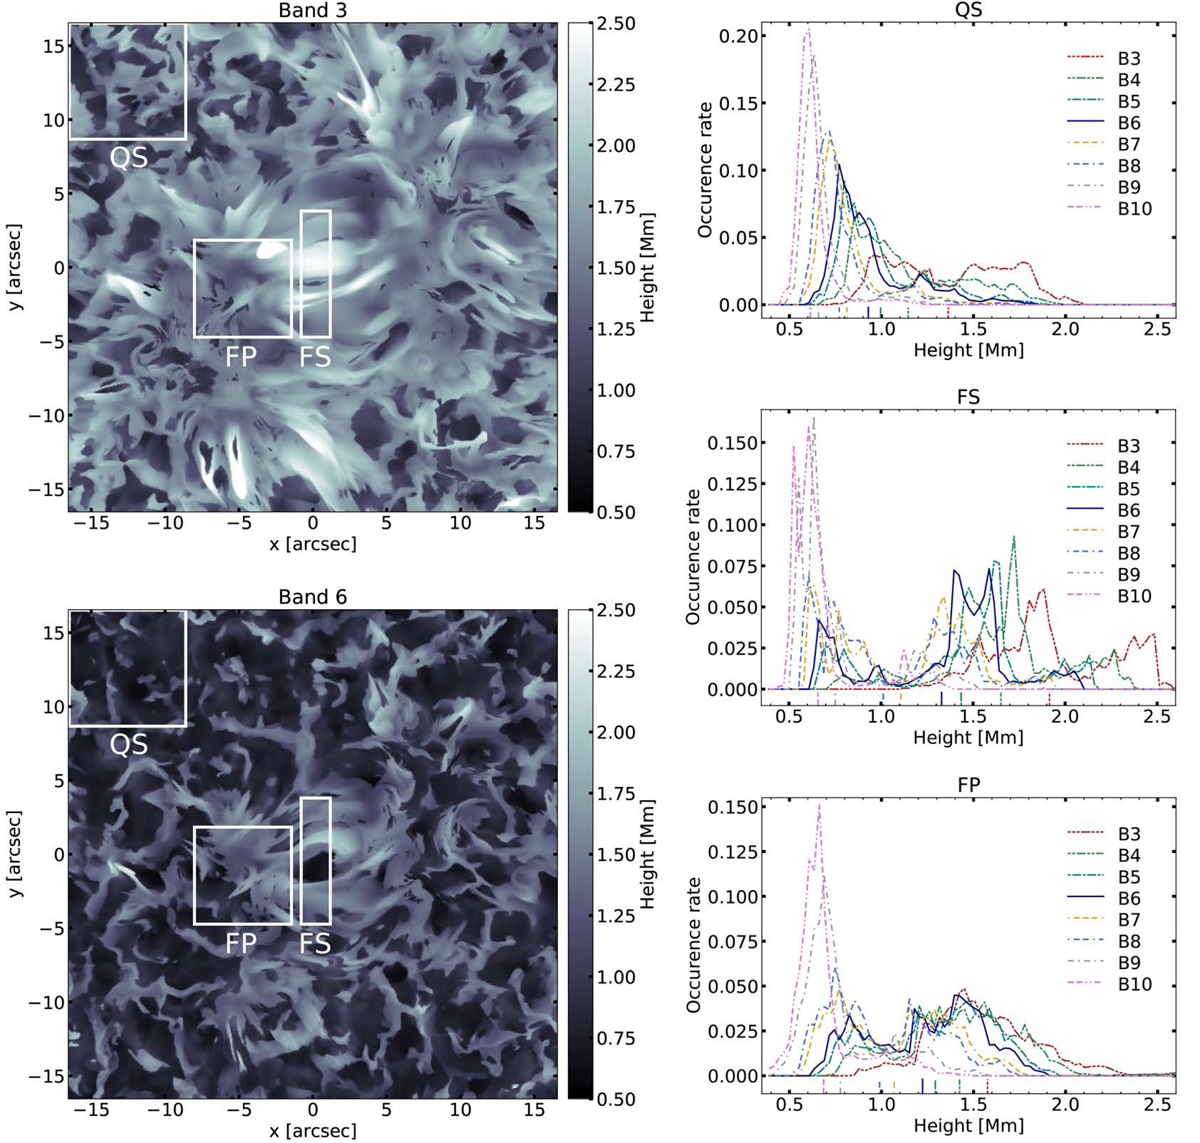
Formation heights of the simulated continuum radiation at original resolution. Left column: formation heights for band 3 (upper panel) and band 6 (lower panel) at z (τλ = 1) for the entire FOV at t = 1650 s. The ranges of the FOV maps are given in the same color-scale to facilitate comparison, but the ranges span between 0.6–3.3 Mm and 0.5–2.3 Mm at band 3 and band 6, respectively. Right column: histograms of the formation heights z (τλ = 1) of all receiver bands (3–10) in the three defined areas, QS (upper panel), FS (middle panel), and FP (lower panel). The distributions are calculated for the time range of t = 1000–2000 s. The mean values of each distribution are indicated at the x-axes with matching line styles. The distributions are given with the same x-axis for convenience, but band 3 in the FP region in particular shows a small enhancement of up to 3 Mm.
Current usage metrics show cumulative count of Article Views (full-text article views including HTML views, PDF and ePub downloads, according to the available data) and Abstracts Views on Vision4Press platform.
Data correspond to usage on the plateform after 2015. The current usage metrics is available 48-96 hours after online publication and is updated daily on week days.
Initial download of the metrics may take a while.