Fig. 2.
Download original image
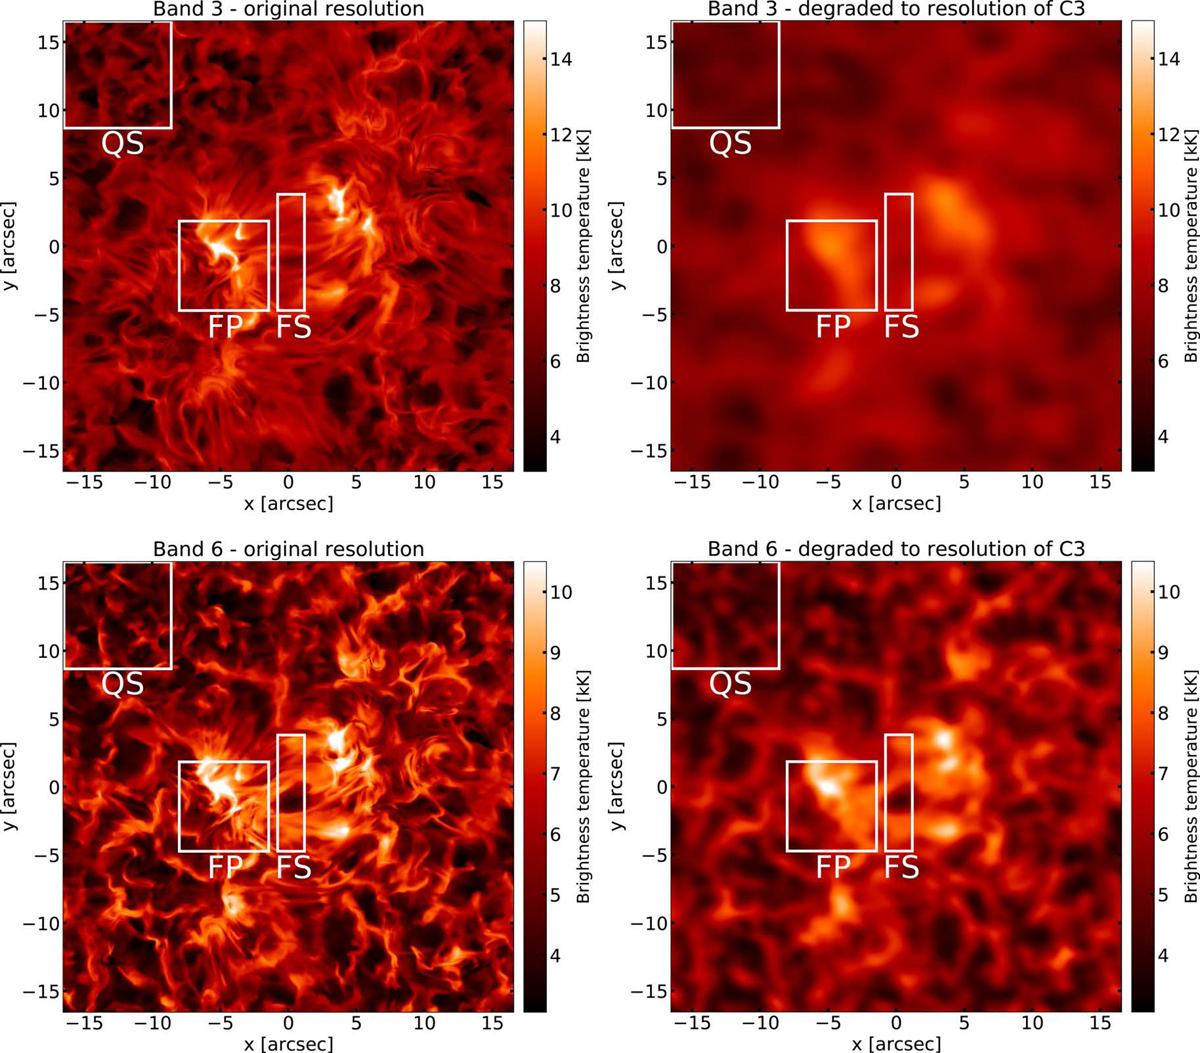
Brightness temperature maps at selected frequencies within receiver band 3 (upper row) and band 6 (lower row) at original resolution (left column) and at degraded resolutions corresponding to observations with array configuration C3 (right column). Three selected regions are marked in the FOV: QS represents the quiet Sun, FP contains the footpoints of the prominent magnetic loops, and FS shows the loop structure between the two footpoints. The snapshots are taken at t = 1650 s. The brightness temperatures at original resolution span a range of 3.1 kK to 16.6 kK for band 3 and 2.9 kK to 11.3 kK for band 6, but are capped in the figure at 15 kK and 11 kK, respectively, to better illustrate less bright structures.
Current usage metrics show cumulative count of Article Views (full-text article views including HTML views, PDF and ePub downloads, according to the available data) and Abstracts Views on Vision4Press platform.
Data correspond to usage on the plateform after 2015. The current usage metrics is available 48-96 hours after online publication and is updated daily on week days.
Initial download of the metrics may take a while.