Free Access
Fig. A.6.
Download original image
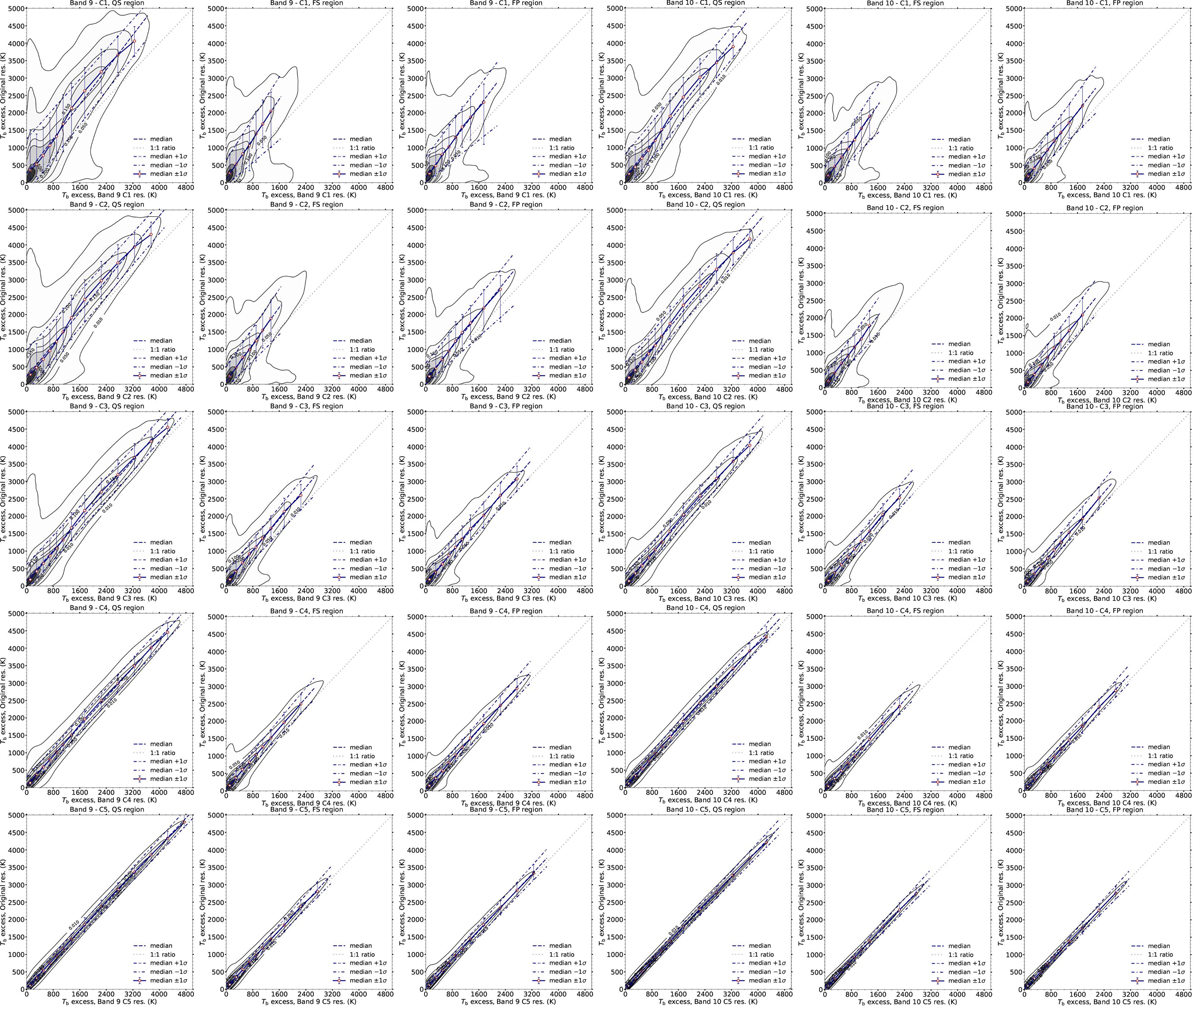
Bands 9 and 10. Density plots of brightening events at the original resolution vs. degraded resolution. Columns show spectral band and target region from left to right: band 9 QS, FS, FP, and band 10 QS, FS and FP. Rows from top to bottom show the resolutions of array configurations C1 – C5.
Current usage metrics show cumulative count of Article Views (full-text article views including HTML views, PDF and ePub downloads, according to the available data) and Abstracts Views on Vision4Press platform.
Data correspond to usage on the plateform after 2015. The current usage metrics is available 48-96 hours after online publication and is updated daily on week days.
Initial download of the metrics may take a while.