Fig. 12.
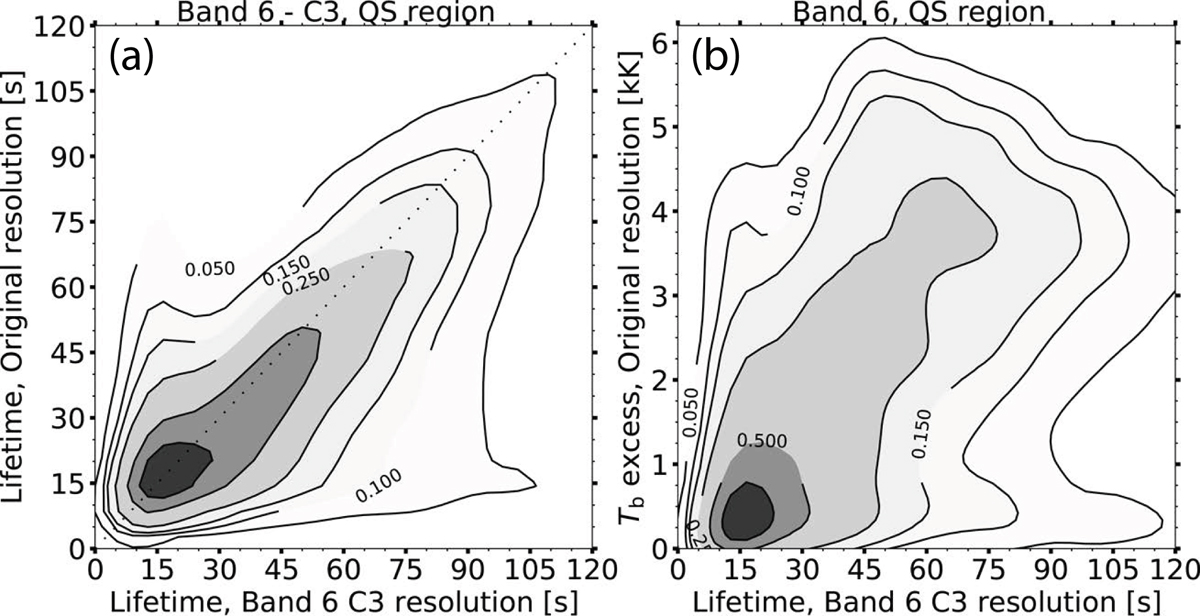
Download original image
Lifetimes of transient brightenings in the QS region at band 6. (a) Lifetimes at original resolution vs. lifetimes at degraded resolution corresponding to array configuration C3. (b) Brightness temperature excess at original resolution vs. lifetimes at degraded resolution corresponding to array configuration C3. The levels of the density plot, 0.05, 0.1, 0.15, 0.25, 0.5, and 0.75, are marked by the contour lines.
Current usage metrics show cumulative count of Article Views (full-text article views including HTML views, PDF and ePub downloads, according to the available data) and Abstracts Views on Vision4Press platform.
Data correspond to usage on the plateform after 2015. The current usage metrics is available 48-96 hours after online publication and is updated daily on week days.
Initial download of the metrics may take a while.