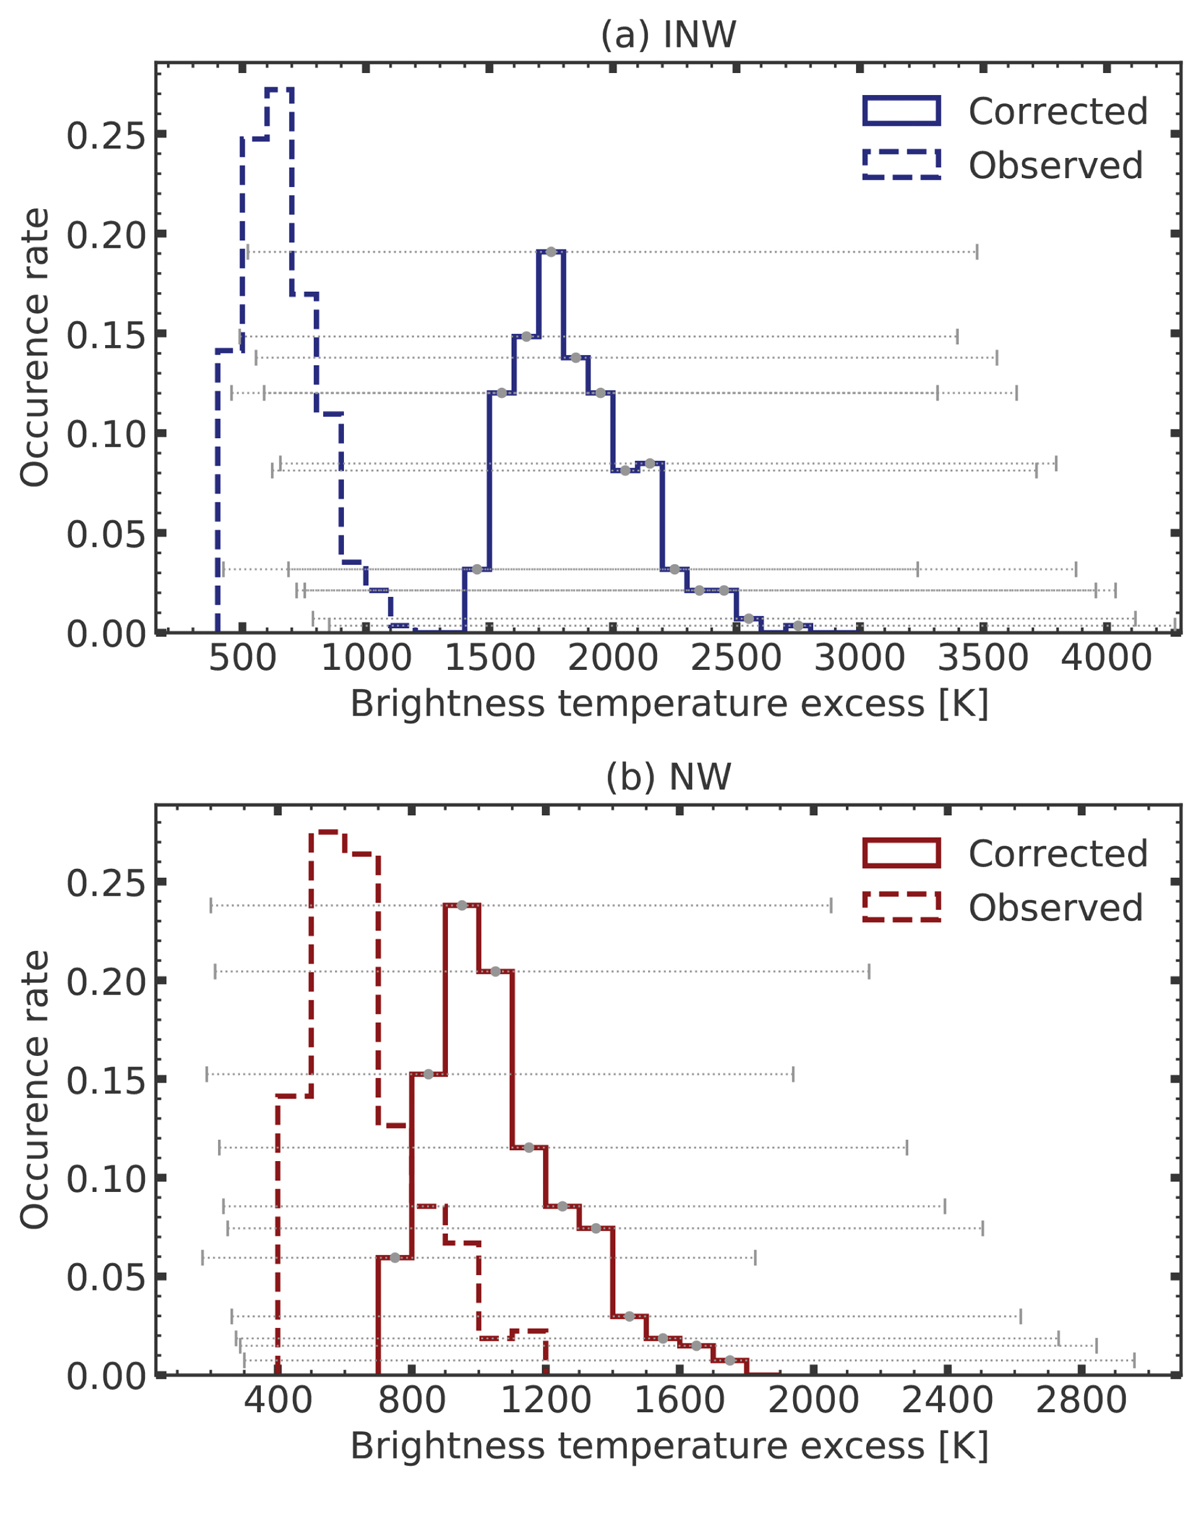
Fig. 11.
Download original image
Distributions of ΔTb of observational brightening events from Eklund et al. (2020) with their corrected ΔTb according to Eq. (3) and Fig. 8. (a) The events observed within the INW regions (dashed blue) along with the estimated distribution using the values for QS region derived here (solid blue), with bars showing ±1σ for each bin. (b) The observed events in the NW regions (dashed red) and the corrected distribution using the values for the FS region, with the indications of ±1σ for each bin.
Current usage metrics show cumulative count of Article Views (full-text article views including HTML views, PDF and ePub downloads, according to the available data) and Abstracts Views on Vision4Press platform.
Data correspond to usage on the plateform after 2015. The current usage metrics is available 48-96 hours after online publication and is updated daily on week days.
Initial download of the metrics may take a while.