Free Access
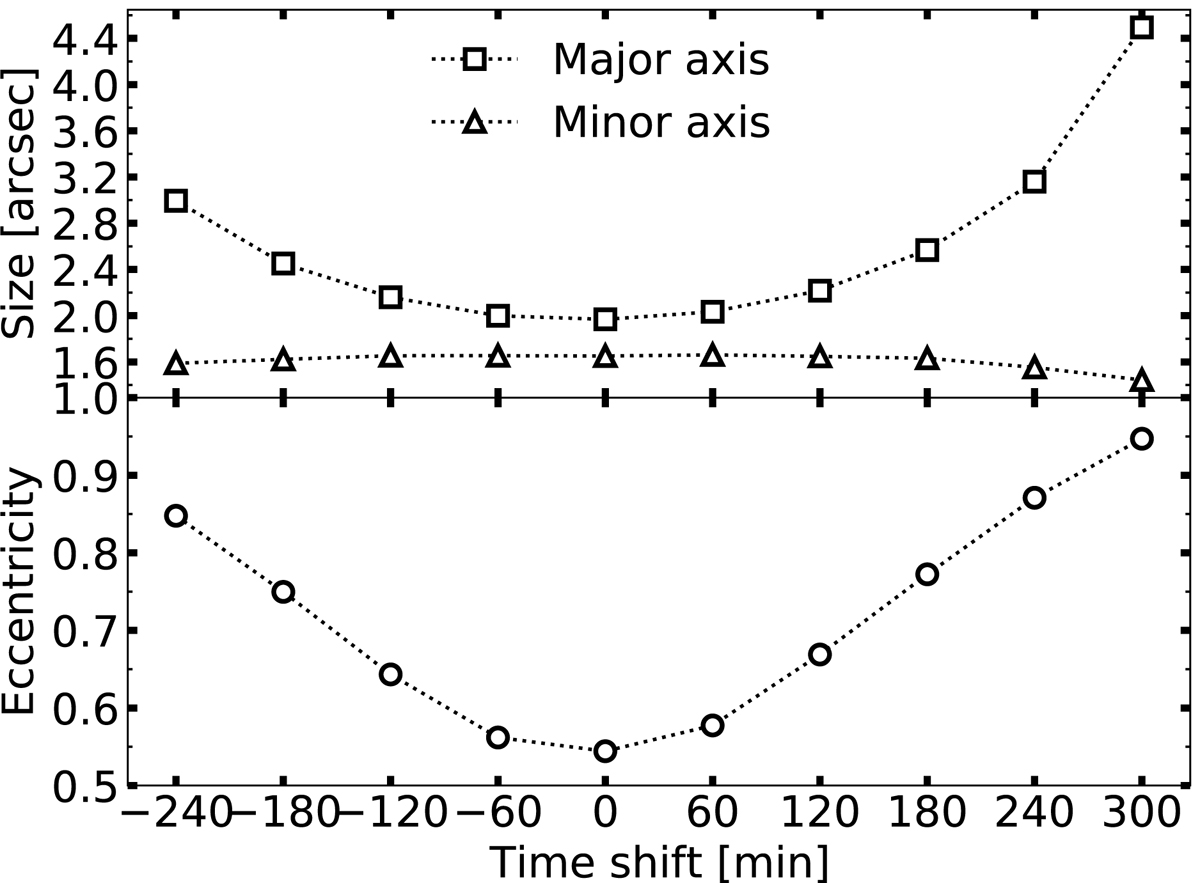
Fig. 10.
Download original image
Clean-beam size (a) and eccentricity (b) with varying time on the day. The example illustrates band 3 at array configuration C3, and the x-axis indicates the time shift from the standard case (close to circular clean beam) we used in our analysis.
Current usage metrics show cumulative count of Article Views (full-text article views including HTML views, PDF and ePub downloads, according to the available data) and Abstracts Views on Vision4Press platform.
Data correspond to usage on the plateform after 2015. The current usage metrics is available 48-96 hours after online publication and is updated daily on week days.
Initial download of the metrics may take a while.