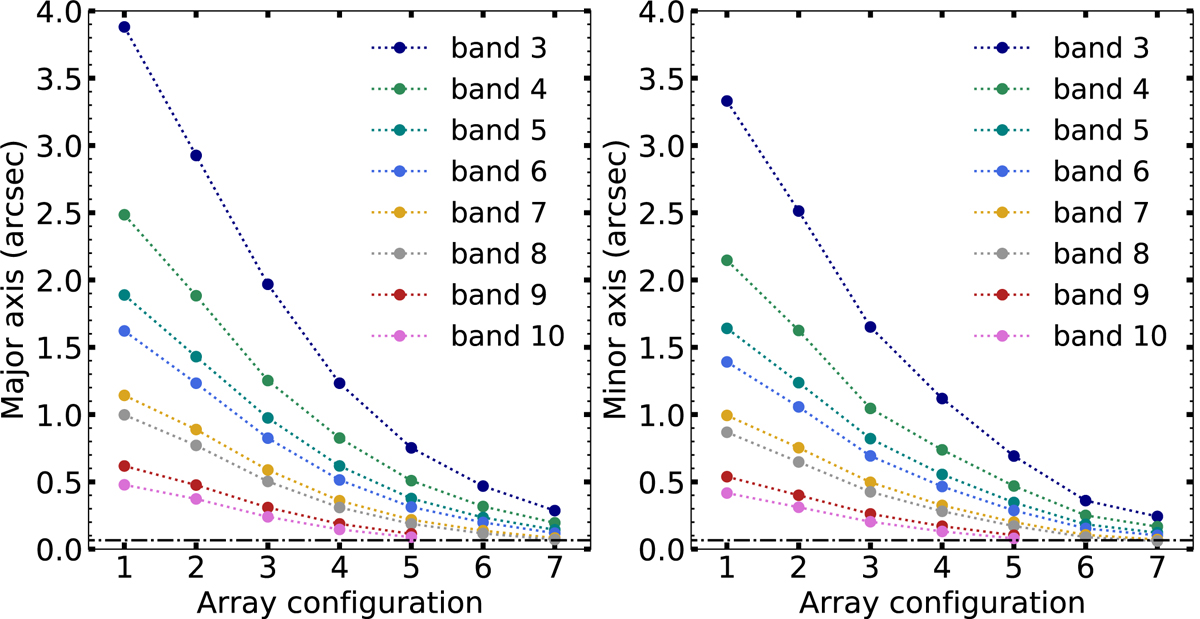
Fig. 1.
Download original image
Major and minor axes of the clean beams corresponding to the respective combination of spectral band and array configurations C1–C7. The values represent the FWHM along the axes of the clean beams for the full spectral width of the receiver bands at a fixed time. The horizontal dot-dashed black lines mark the limit of the cell size of 0.066 arcsec of the original model.
Current usage metrics show cumulative count of Article Views (full-text article views including HTML views, PDF and ePub downloads, according to the available data) and Abstracts Views on Vision4Press platform.
Data correspond to usage on the plateform after 2015. The current usage metrics is available 48-96 hours after online publication and is updated daily on week days.
Initial download of the metrics may take a while.