Fig. 6.
Download original image
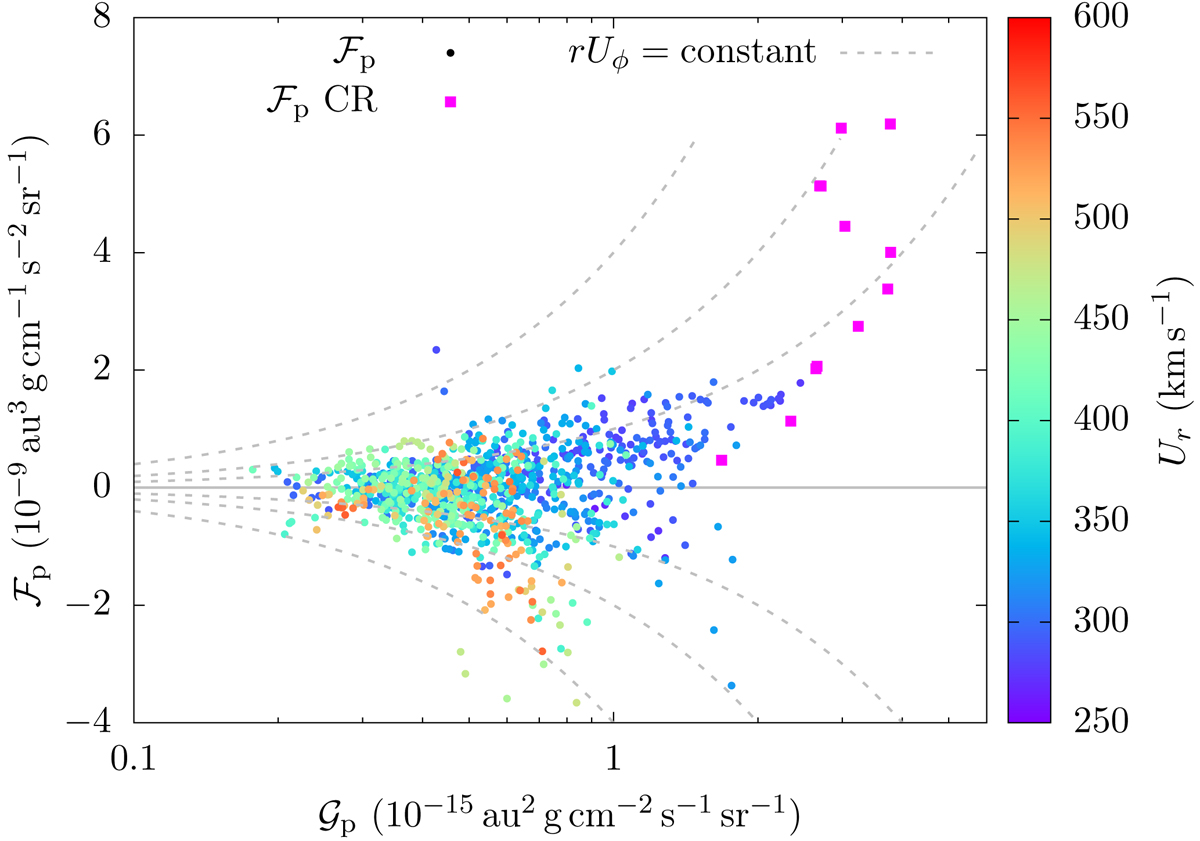
Dependence of the proton contribution ℱp to the angular-momentum flux on the radial proton mass flux 𝒢p. The point colour represents the value of Ur for each measurement. The magenta squares represent measurements during the time of the compression region (CR) on 2020-09-06. The grey dashed curves indicate contours of constant rUϕ.
Current usage metrics show cumulative count of Article Views (full-text article views including HTML views, PDF and ePub downloads, according to the available data) and Abstracts Views on Vision4Press platform.
Data correspond to usage on the plateform after 2015. The current usage metrics is available 48-96 hours after online publication and is updated daily on week days.
Initial download of the metrics may take a while.